![Tron [TRX] Price Analysis: Tron goes bearish in the past 24 hours](https://crypto-economy.com//wp-content/uploads/2019/07/tron-analisis.jpg)
After an encouraging rally from 4th through 6th of november, Tron turned bearish from the 7th until today on 9/11/2018.
At this time the price was at $0.02316 with a 24 hour high of $0.02370 while the 24 hr. low was set at $0.02287. The cryptocurrency has declined with 0.00033 as the 24 hour volume hit 6.4 million. The 3 day downtrend has come in contrast with a general uptrend of other leading altcoins such as Ripple and Litecoin.
A look at the indicators
Let us consider the trend in light of popular indicators over the past 1hr period and the past 24 hours.
The past 1 hour
- Bollinger Bands
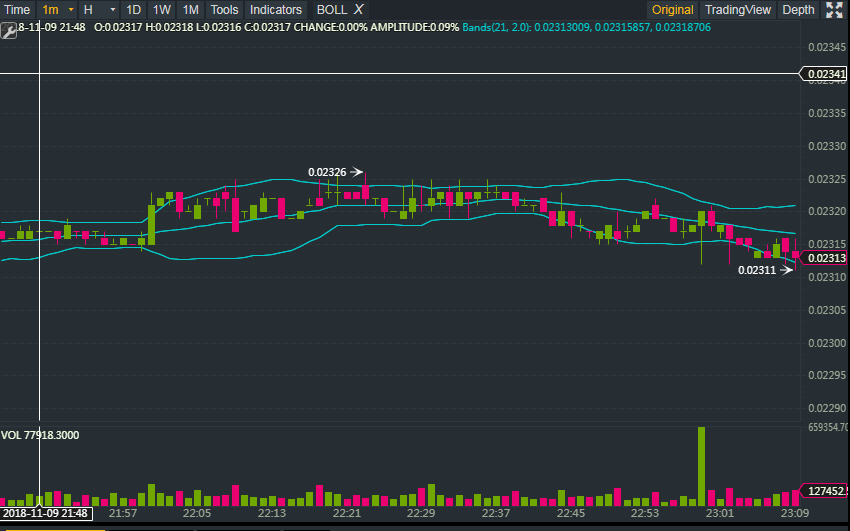
The Bollinger bands are pointing towards a possible downtrend to continue today’s bearish price movement. The price has been maintained within the $0.02326 and $0.02312 range. The past 15 minutes have seen a divergence of the bands with a notable downtrend to the current price at 0.02312. The graph is in contact with the lower band thus indicating a possible continuation of the downtrend. The divergence has emerged from a previous Bollinger “squeeze” which came after another zone of divergence in the first 15 minutes of the hour.
- MACD
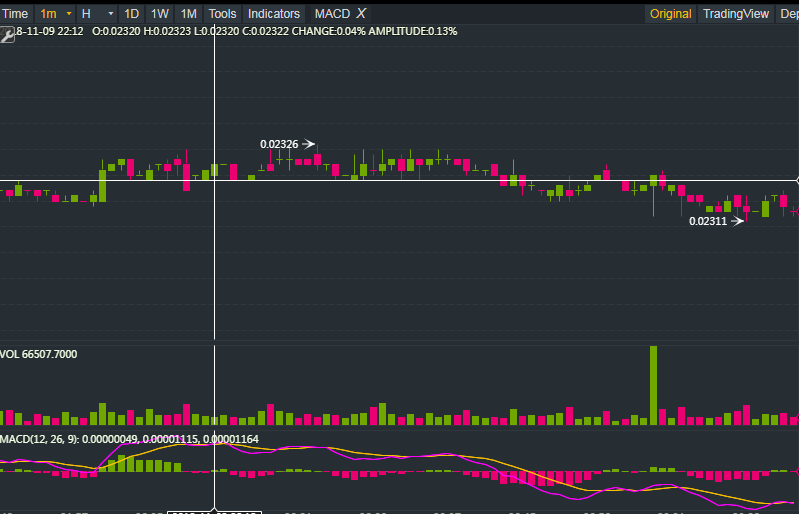
Currently, MACD1 has made a crossover “bear-wards” indicating a possible a continuation of a downtrend which begun about 30 minutes ago. Previous crossovers were rather un-definitive as they occurred within the period of sideways trend.
- RSI
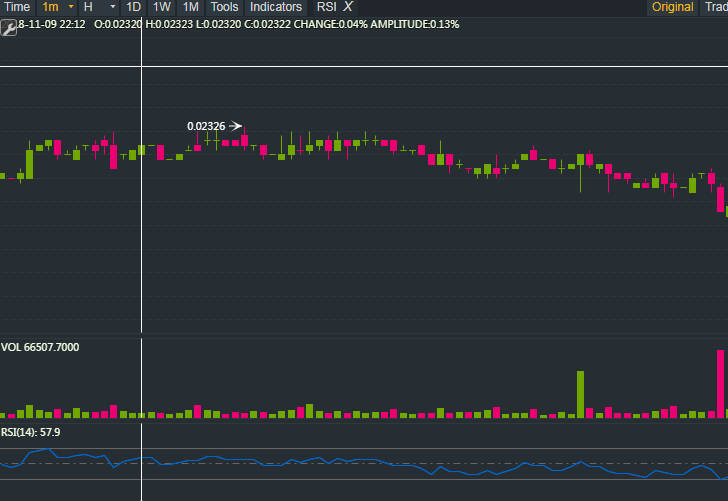
The line is currently approaching the oversold zone at 30. The trend has been declining below 50 for the past 30 minutes, which is consistent with the price trend and the Bollinger Bands.
The past 24 hours
- Bollinger
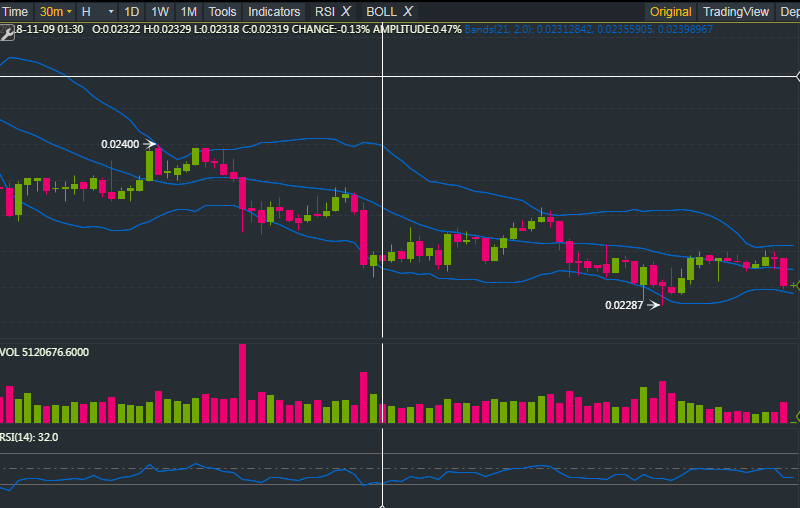
The bands have been converging for the past 24 hrs. Leading to a squeeze which has been taking place for 1.5 hours. This might be indicative of a further downtrend.
- MACD
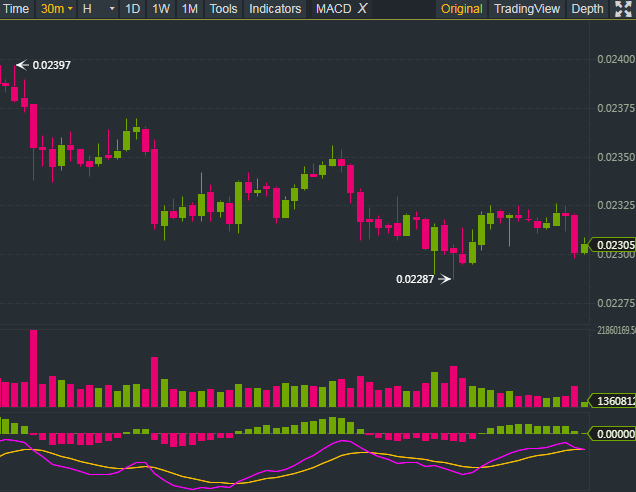
Faster moving average approaching another crossover which is the fifth of the past major crossovers within the past 24 hours. The current crossover is bearish which is consistent with the Bollinger’s trend.
- RSI
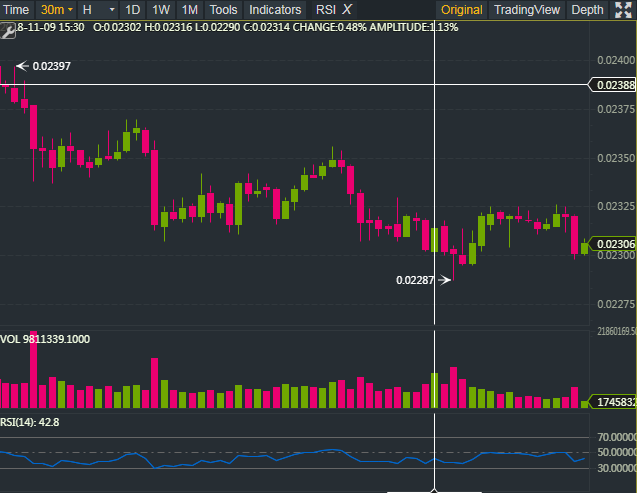
The trend has been below 50 as it bounced off the oversold zone with a solitary break above the 50 mark. Currently it is descending towards 30, which is indicative of a downtrend consistent with other indicators.
Conclusion
The past 24 hrs. have been a continuation of the 3-day downtrend with all the indicators pointing towards a possible continuation of the bearish movement. However, it is important to note that today’s trend is more of a part of a larger upward trend since 12 September which hit a record low at 0.01700