By Sep 21, XRP prices were up 300 percent from week ending Sep 16 lows as prices printed 80 cents for the first time in five months. Needless to say, XRP prices remain a strong buy backed by strong fundamental expectations from Ripple—the launch of xRapid in a few months and high-level bank partnerships—PNC and NCB.
Latest Ripple News
It has been a seismic week for XRP, the on-demand liquidity tool for xRapid and a product of Ripple Labs. A different, independent asset, XRP is literally short of superlatives has its rapid moon sling got many commentators by surprise.
Within two days, XRP valuation was up $20 billion. By end of last week, statistics showed that the coin was up 100 percent meaning it had double its week over week valuation. It could potentially add more this week further lifting overall crypto market cap.
At current valuation, XRP market cap is at $22.5 billion, down $2 billion after peaking at around $24.6 billion on Sep 21 at the back of abnormal high trading volumes lifting prices with it.
There has been alt of speculations as to what caused this resurgence. Well, because Ripple the company is yet to confirm, we can only speculate. Coincidentally, this rise in prices came a few days after Sagar Sarbhai, head of regulatory relations for Asia-Pacific and the Middle East at Ripple, said the company plans to launch xRapid in less than 60 days.
The solution, xRapid is one of Ripple’s core products and uses XRP as an on demand liquidity tool as they facilitate cross border payment solution.
This comment triggered an influx of XRP demand and in a FOMO moment, the prices of the digital asset rose due to demand. Aside from Sagar’s announcement, Ripple has had the support of PNC Bank and Saudi Arabia’s largest bank by market Cap, NCB.
Ripple (XRP) Price Analysis
Weekly Chart – XRP Price prediction
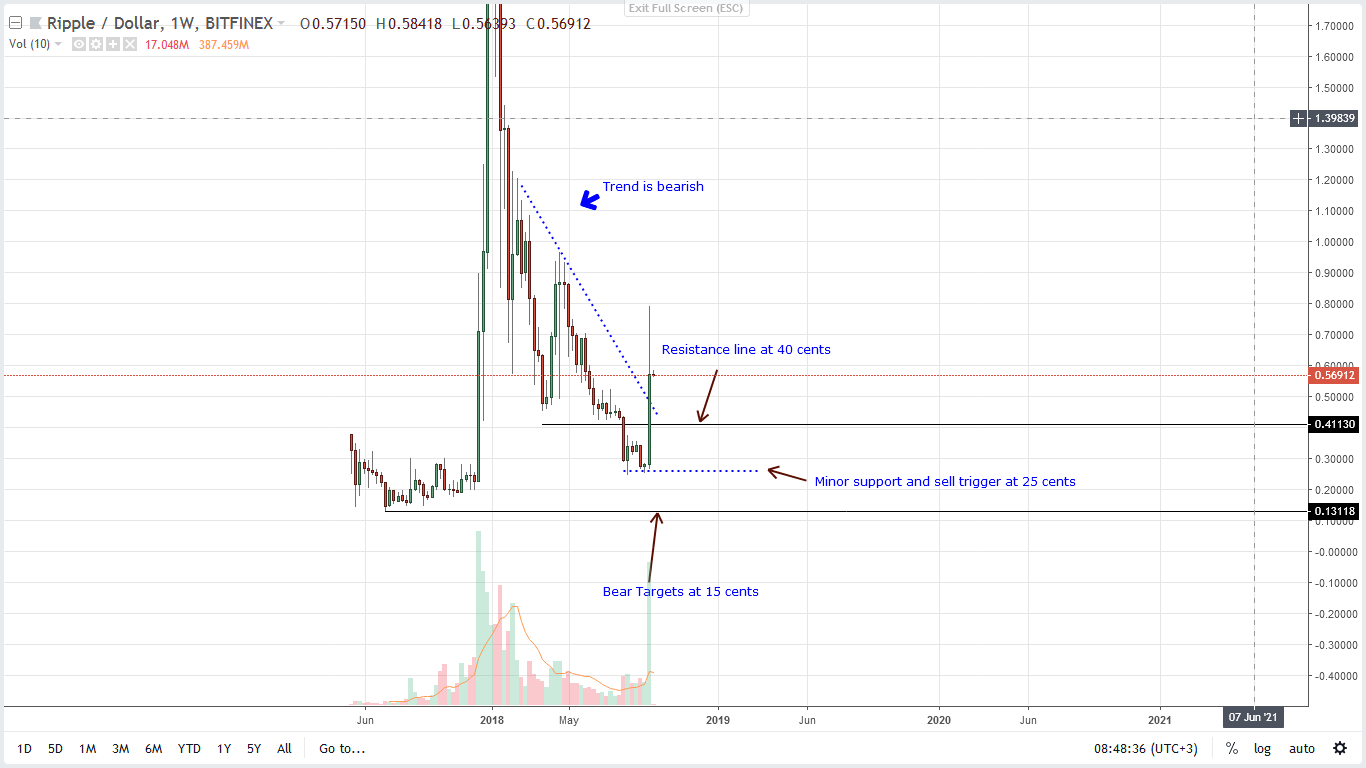
By week ending Sep 23, more than 1.7 billion orders had been executed at BitFinex. That’s roughly 10 times what it was a couple of weeks ago demonstrating how fierce demand has been at BitFinex and other high liquid exchanges.
The result is that conspicuous high volume, wide range bullish engulfing candlestick lifting off from 25 cents, our previous main support line. Not only do we have a shift in demand but with a wide trade range, prices are now trading above the main resistance trend line which had capped gains in the last eight months or so.
If anything, this is a straight buy but with wild swings, a perfect entry is required. Considering how candlesticks are laid out, XRP is finding upward resistance as show by last week’s long upper wick.
We suggest buying at dips at or around key Fibonacci retracement levels anchored at last week’s high low.
Daily Chart – XRP Price prediction
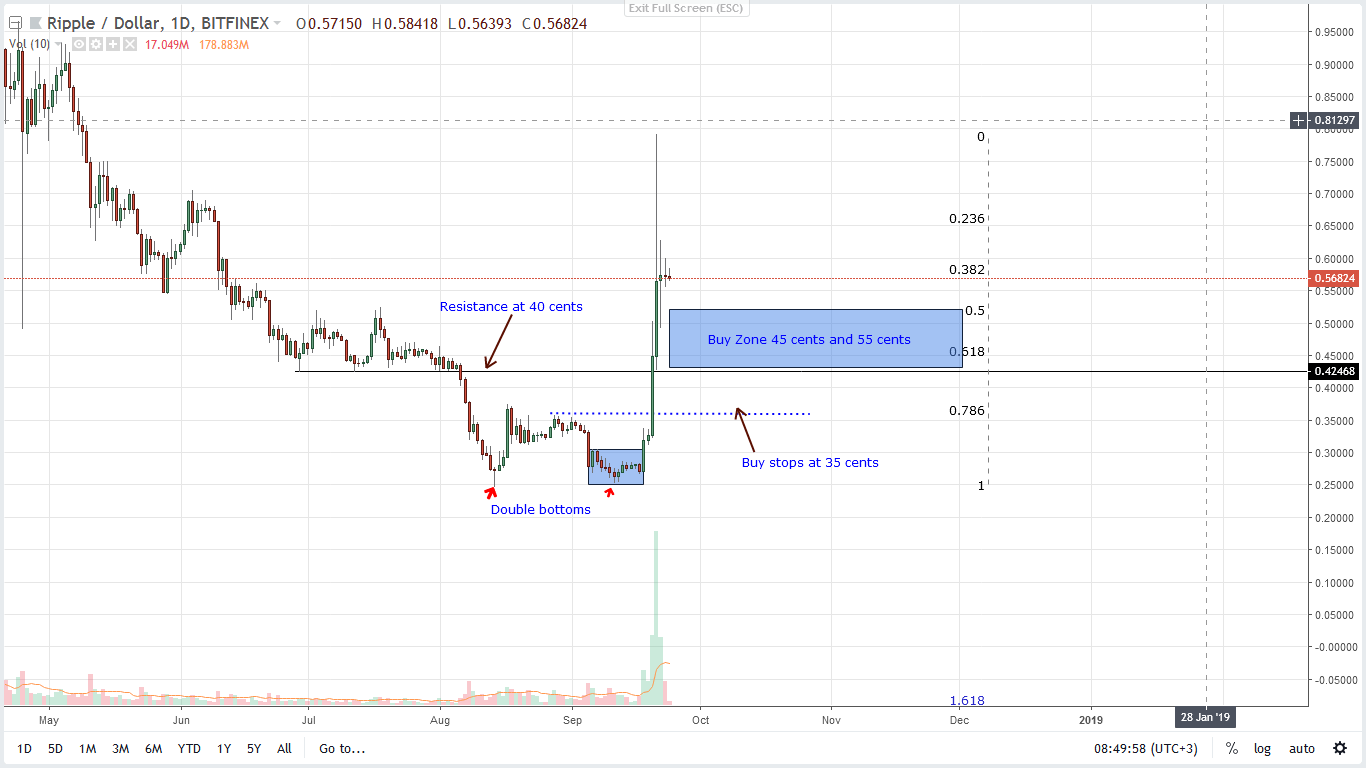
Last week’s rapid gains did breach two strong levels of resistance at 40 cents and 55 cents. If we place a Fibonacci retracement tool between last week’s lows then our potential buy zone lies between 45 cents at around the 61.8 percent Fibonacci level and at 55 cents, the 32 percent level.
First targets would be at Sep 21 highs at 80 cents with safe stops at 45 cents. Regardless, we expect XRP prices to trudge this week as it moves horizontally as it consolidates horizontally in a mid range accumulation phase.
Disclaimer: Views and opinions expressed are those of the author and aren’t investment advice. Trading of any form involves risk and so do your due diligence before making a trading decision.