
The market is not an unpredictable entity, but it is impressive. Many times it shows us the possible paths it can take (by using different methods), then confirming them with certainty and showing us that what it said once, it said it very seriously. In this technical analysis of the most powerful cryptocurrencies we try to put a voice to this market.
One of these occasions is in full development. On Saturday, July 14, the market decapitalized in an impressive way (after a strong onslaught of the bears), several currencies reached figures that were not seen for some time, as the main currency of the market, Bitcoin, which closed close to 2,900 million dollars, an amount that without doubt we had not contemplated for quite a few days.
Then, shortly afterwards, about 500 million dollars came in to revive the BTC and the market in general, in a kind of breathing that allowed the oxygenation of all the coins, which results are very positive for all.
It is interesting to see that many times, the “unexpected” is what happens, as indicated by the Principle of Opposite Opinion. Without further ado, let’s see what happened during the last week in the top 10 currencies with the highest market capitalization.
Technical analysis Bitcoin, BTC / USD
This week new and impressive things happened, just after commenting on the update of July 9, BTC suffered a sharp decline of approximately 10%; the prices of the currency fell during a whole week, so that just 1 or 2 days ago, it will find ground, which seems that for now it is able to stop the onslaught of the bears.
After the outlook of about 7 days ago, the bears took strength and went to attack again, during that time the bulls side was completely cornered, so the bears managed to pull back the bulls -losing space- to the $ 6,100 area, an area in which despite the seemingly unstoppable strength of the bears, the bulls managed to entrench themselves and take control of the area, making that area a clear bastion in their favor, from now on.
In the area of $ 6,100 the pressure to purchase increased with a very interesting force, at that time it was expected that the bears brake that area to go to the next support, but the bulls “neither short nor lazy” showed that the bears, are not the only protagonists in a monologue in which the price of the BTC only falls, if not that it is more of a shared stellarity between bulls and bears, something that the bulls do not intend to allow to forget, although the bears have selective memory.
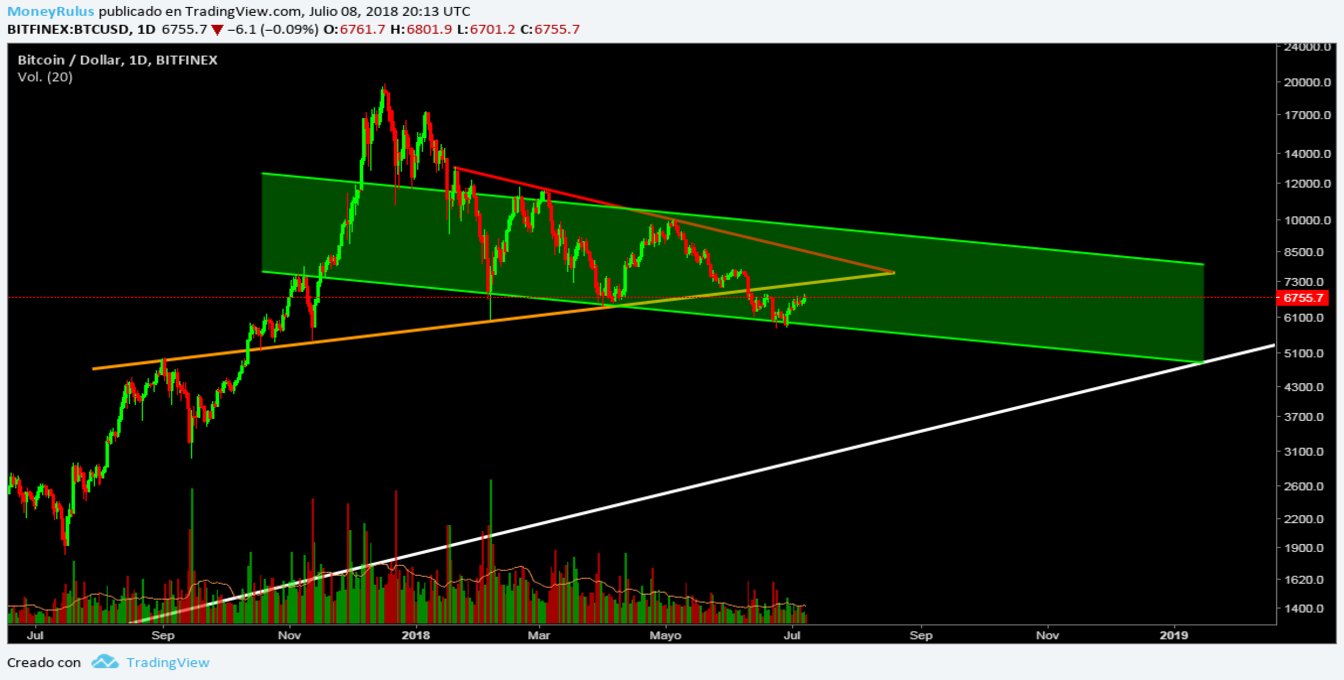
Observing the BTC / USD pair in the BitFinex exchange house, we perceive things that stand out in sight, it is clear that before starting the abrupt descent of which we have already spoken, the price made the Pull back towards the resistance represented by the line trend – orange – bullish mid-term.
This fact indicates that now undoubtedly that area is represented as a hard resistance to beat, resistance that can be a strong ceiling in the future advance of the price.
The price approached the lower part of the channel – green – down in the medium term, although it has not yet touched the area itself, so it may be useful at the time of providing a support, with ground potential in the future.
The distance with the trend line – white – long term remains constant, only that at this moment the price seems to have veered subtly in the direction of itself, a sign of the timid intention that carry the quotes so far, apparently the only option is to wait.
The volume increased slightly during the price decline, but at this time it is low again, it is possible that the bulls are not able to maintain this pace for a long time, although they have undoubtedly shown greater strength than they appeared.
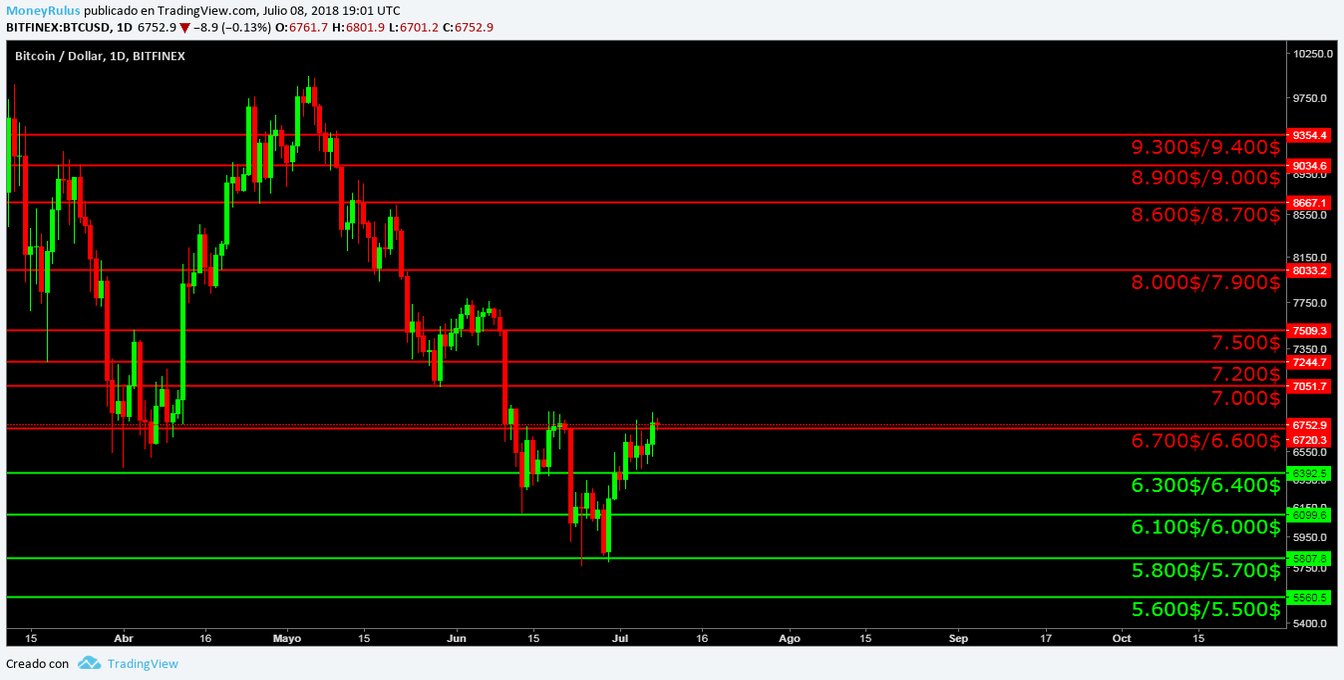
- The bears can create serious resistance in the areas of $ 6,300 / $ 6,400, $ 6,600 / $ 6,700 and $ 6,800 / $ 6,900 (the area in which they lashed out last week).
- On the other hand, the bulls, can build supports in the $ 6,100 / $ 6,000 (the last floor in which they took control, until now …), $ 5,900 / $ 5,800 and $ 5,800 / $ 5,700.
Technical analysis Ethereum, ETH / USD
Ethereum is usually a faithful follower of BTC movements, but lately it has been a bit more independent (of course, “a little” does not mean that it is 100% independent) since while BTC made new absolute minimums, it only made new relative minimums ; It is interesting to see that although it is the second most important currency in the whole market, it still has a strong correlation with BTC, even though the project is huge and as an idea, it can change the world.
During this week, the bears took control in a manner very similar to BTC, they lashed out, taking away much territory from the bulls, who had to give ground, until they reached the area close to $ 417, a area in which the bulls regained control and made a remarkable rebound.
So far, the rebound itself is in process, so we must wait to see how far the bulls manage to increase prices, how far will they go?

The ETH / USD pair at the Kraken exchange house shows that the price bounced on the long-term bullish – blue – trend line. This area until now is established as a strong support to take into account from now on, since it keeps the quotes of the currency, within the great laterality of which we have already spoken, the great triangular pattern.
The trend line – orange – descending in the medium term, remains in force, although the price has not approached it in a certain time.
The volume shows that the contraction continues gradually, so we can understand that it continues to validate the symmetrical triangle pattern formed by both trend lines, both blue and orange.
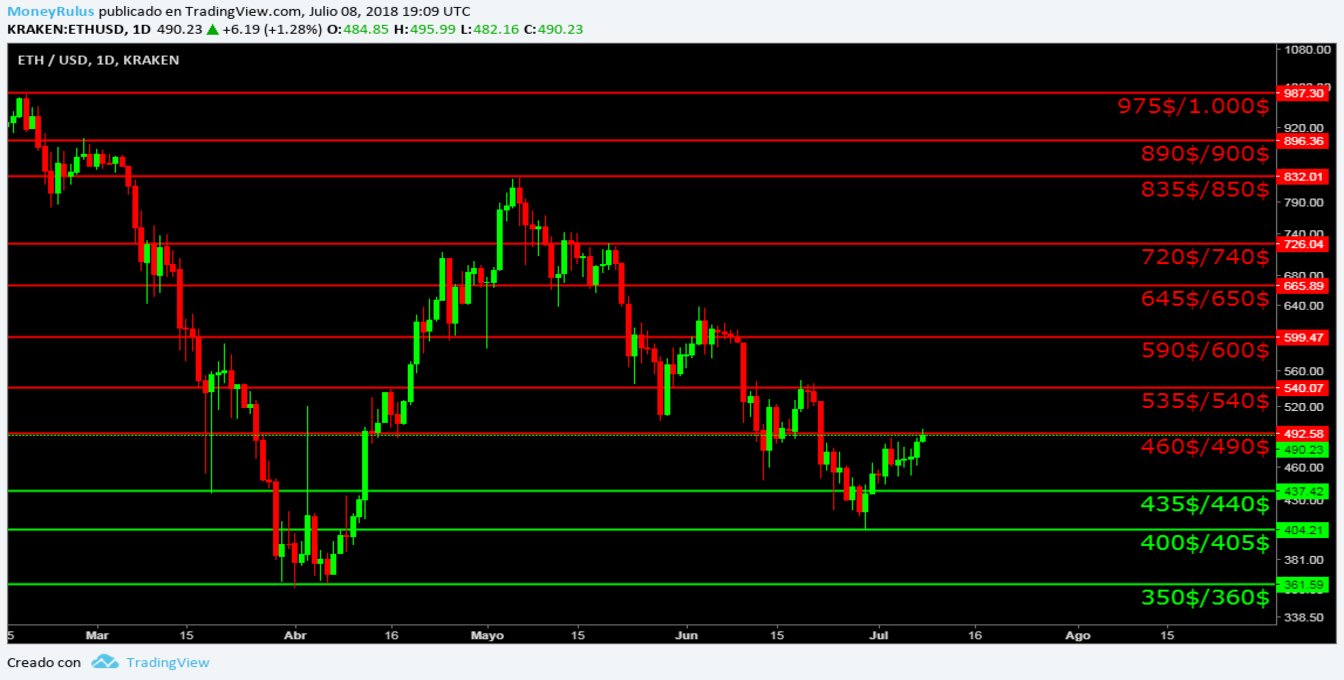
- The bears can form resistances in the areas of $ 460 / $ 490 (in which they started the last advance), $ 535 / $ 540 and $ 590 / $ 600.
- The bulls can do the same and form supports in the $ 435 / $ 440, $ 400 / $ 405 and $ 350 / $ 360.
Technical analysis Ripple, XRP / USD
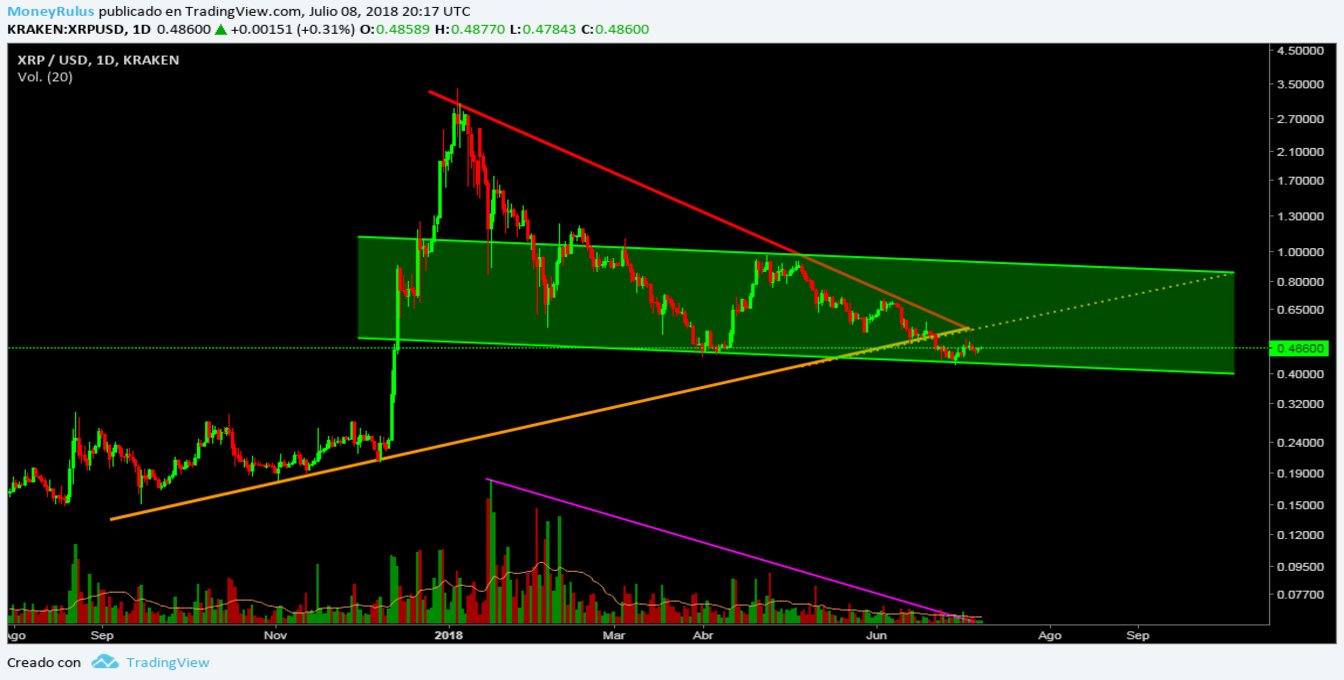
The XRP / USD pair in the Kraken exchange house shows how the trend lines that we take into account remain valid, both the long-term bullish-orange trend line and the medium-term-red-descending line.
The price, on the other hand, rebounded in the lower part of the channel – green – slightly descending, medium term. This indicates that this area is established as a strong support from now on, since it is the one that has managed to confront it, to all the fury that the bears printed in the fall that lasted all week, this undoubtedly has merit.
It is important to have this channel very much in mind, since little by little it takes the price in a downward direction, in a somewhat abrupt, but bearish way at last.
The volume is very low as we have seen for weeks, this lack of strength is not a signal that generates confidence in the currency, so it is important to be very careful and suspicious.
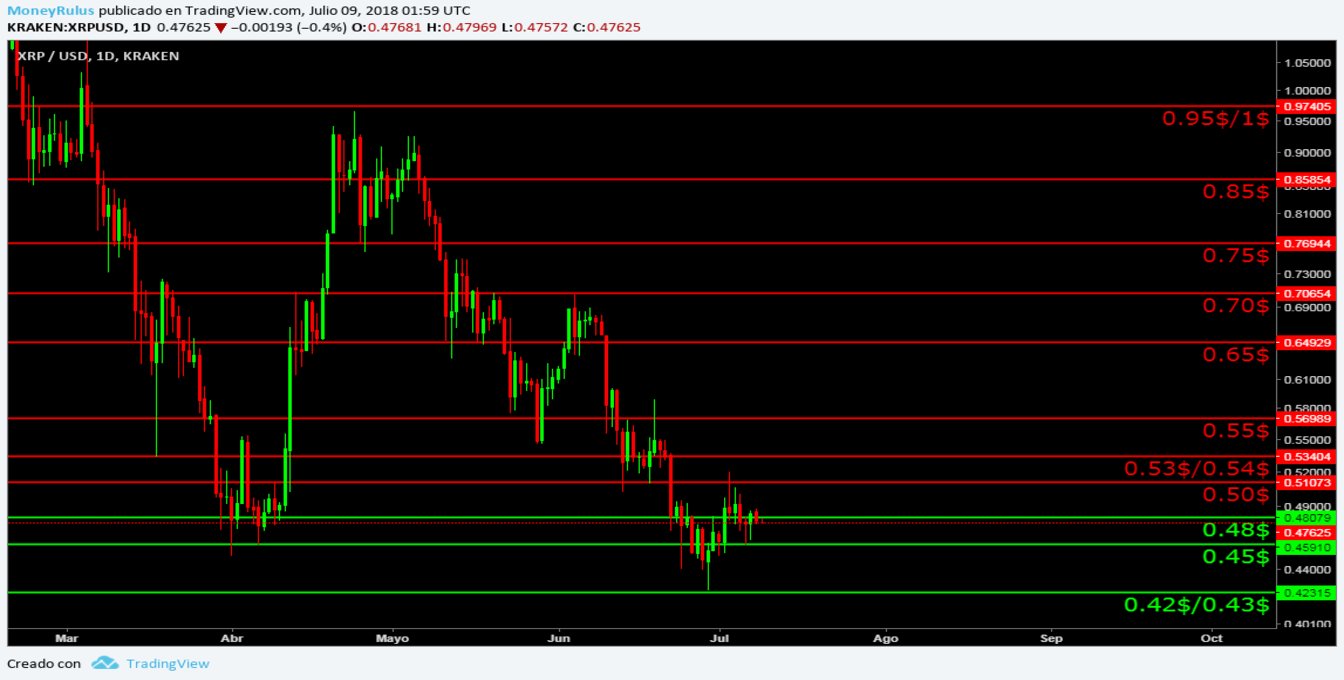
- Bears can create resistance in the areas of 0.45 $, 0.48 $ and 0.50 $ (the last strong ceiling).
- Bulls can form supports at 0.42 $ / 0.43 $ (the last valuable soil), 0.38 $ / 0.39 $ and 0.34 $ / 0.35 $.
Technical analysis Bitcoin Cash, BCH / USD
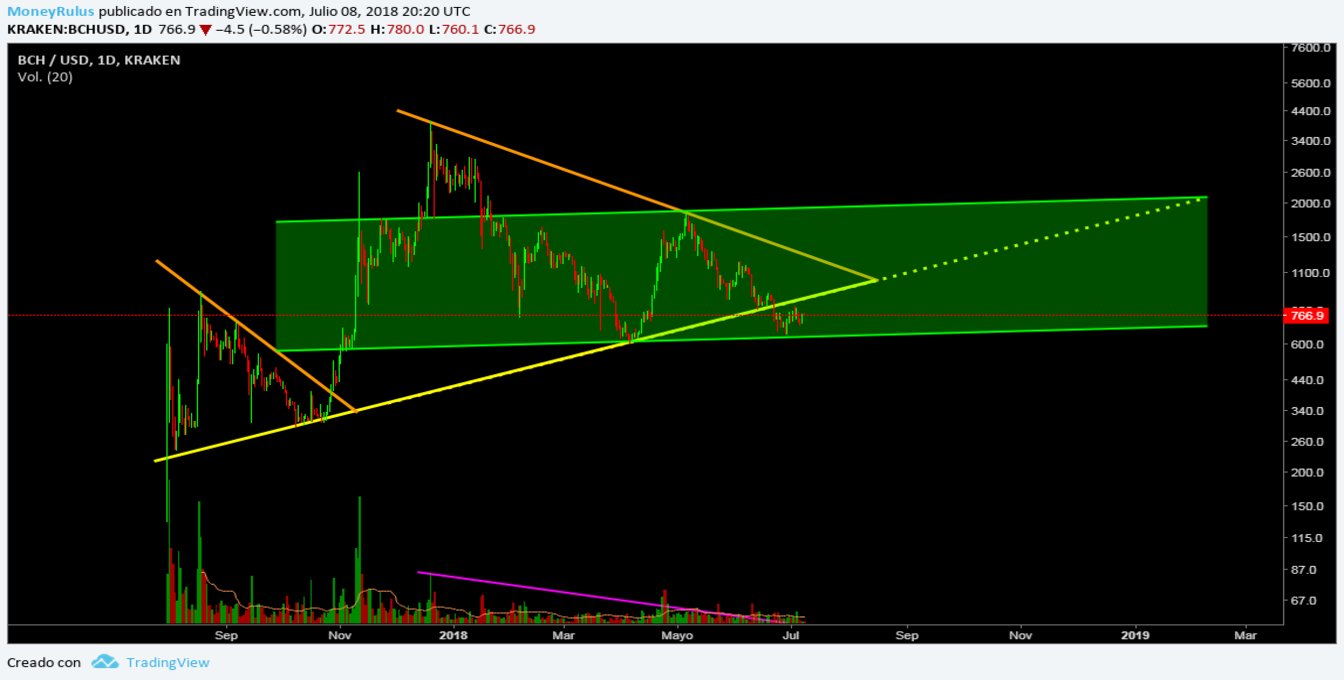
Looking at the BCH / USD pair at the Kraken exchange, it is apparent that the price culminated in the Pull back towards the long-term trend line – yellow – this indicates that from now on that area is established as a possible ceiling, since there the sales pressure can exceed the purchase intention and create a resistance.
Also, it is observed that the price found support in the channel – green – slightly ascending, medium term, which (contrary to the yellow trend line) now constitutes a support that can stop another onslaught of the bears in its eagerness to make new minimums, both relative and absolute.
The volume is not particularly strong for a long time, it is still in a constant state of climbing a little and lowering another little, without disappearing altogether, but not showing an admirable strength. It seems like a simple marathon strategy in which it tries to stay alive as long as possible, at the expense of not showing strength at all, and therefore does not accompany any movement, as expected.
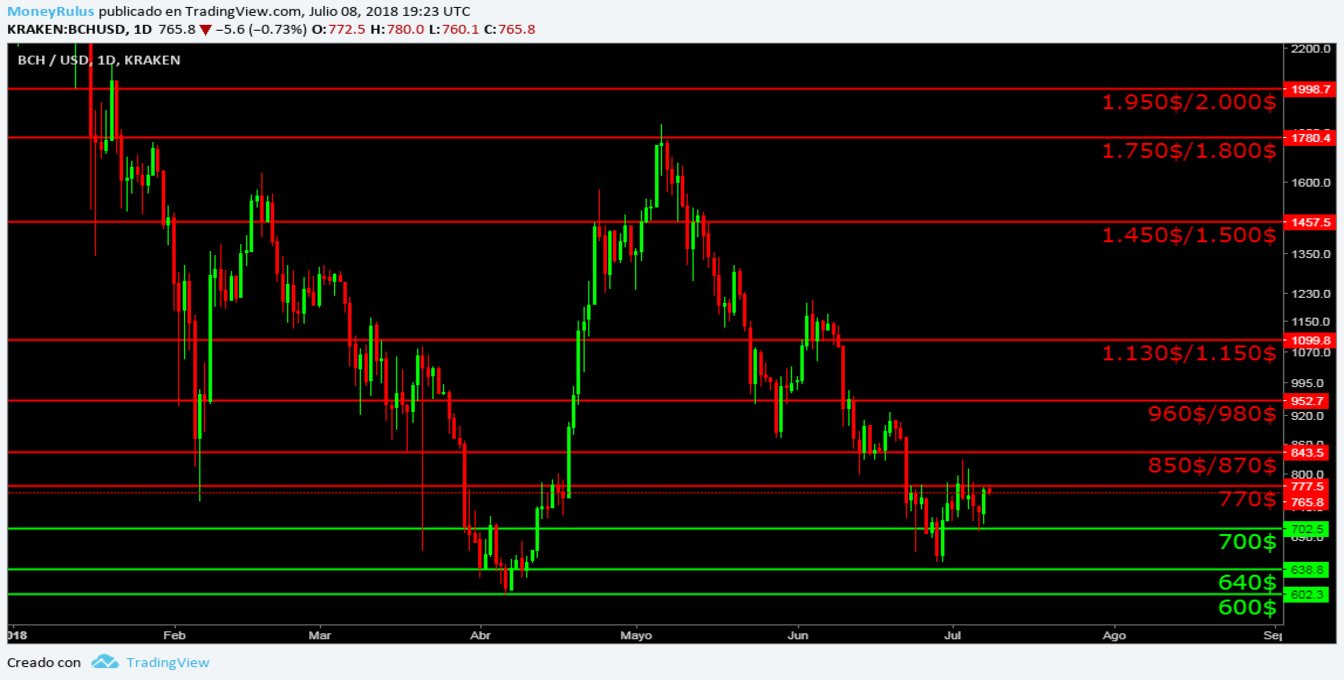
- Bears can create great selling pressure, and build resistances at $ 770, $ 850 / $ 870 (a strong area for the bears) and $ 960 / $ 980.
- The bulls can create supports in the areas of $ 700, $ 640 and $ 600.
Technical analysis EOS, EOS / USD
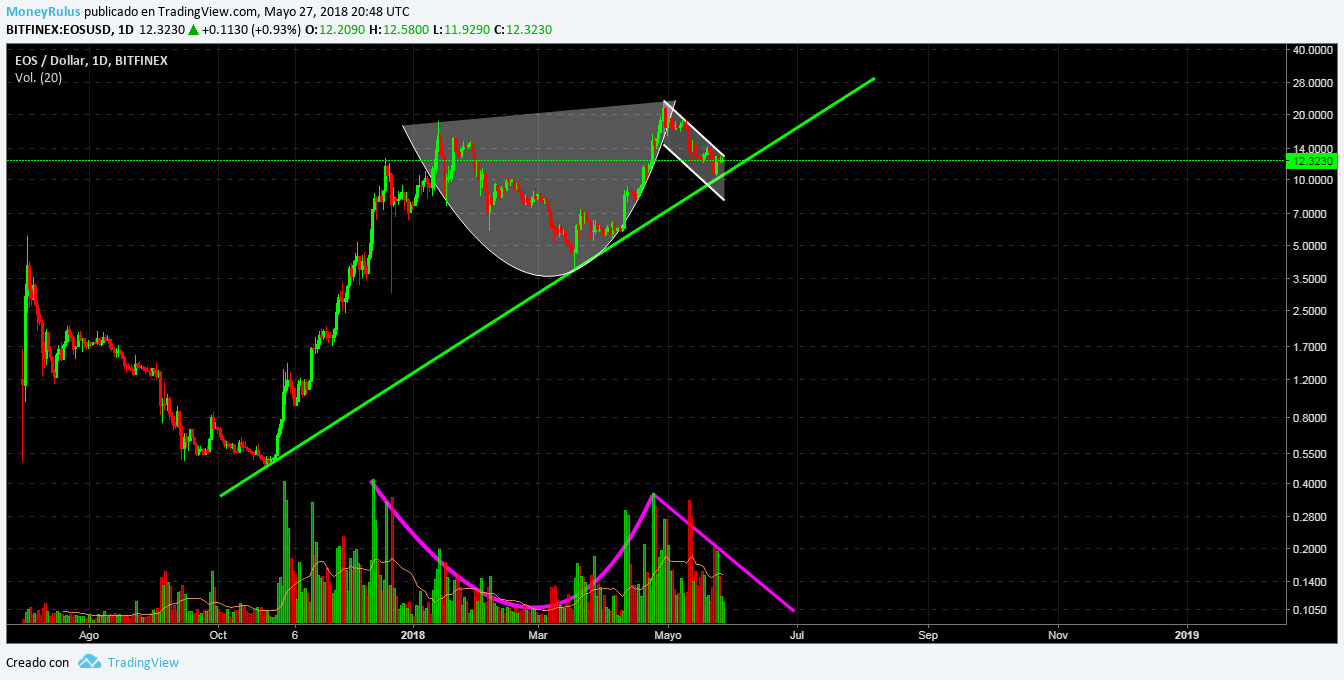
The pair EOS / USD in the BitFinex exchange house follows persistent with the Cup & Handle pattern that already we know about, after the price bounced in the high part of the channel – white – descendant of short term, that forms the Handle, made a relative maximum, to then fall again, but without touching once more the upper part of the descending channel.
At this time, the price found a support near the ground where it found enough buying power a few days ago, in the last touch at the top of the descending channel. The pattern is still valid and interesting, although it is important to be patient.
The volume supports the pattern in a very good way, there is a decrease in force since the price falls within what can be considered as the Handle, so no doubt the seriousness remains valid until now. These types of patterns represent a very bullish possibility, but should be treated with care and cunning.
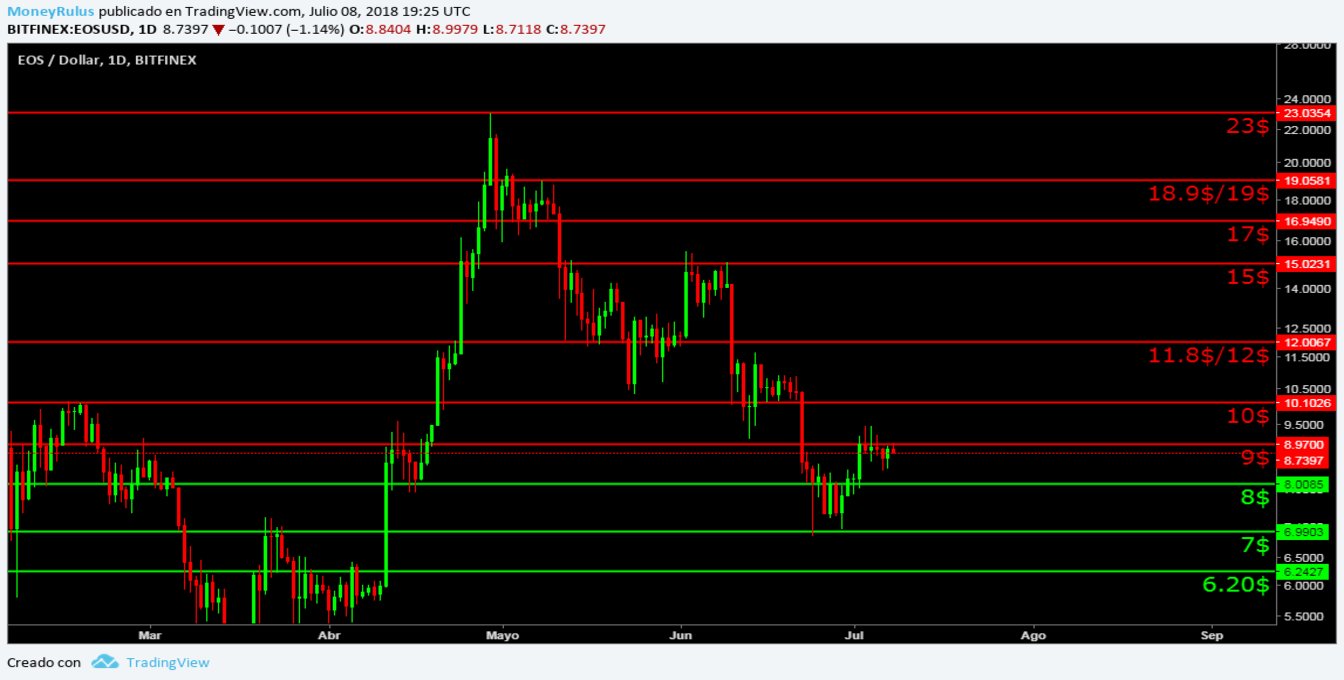
- Bears can create resistances at $ 8, $ 9 and $ 11.8 / $ 12.
- As the bulls can form supports in the bands of $ 7, $ 6.20 and $ 5.60.
Technical analysis Litecoin, LTC / USD
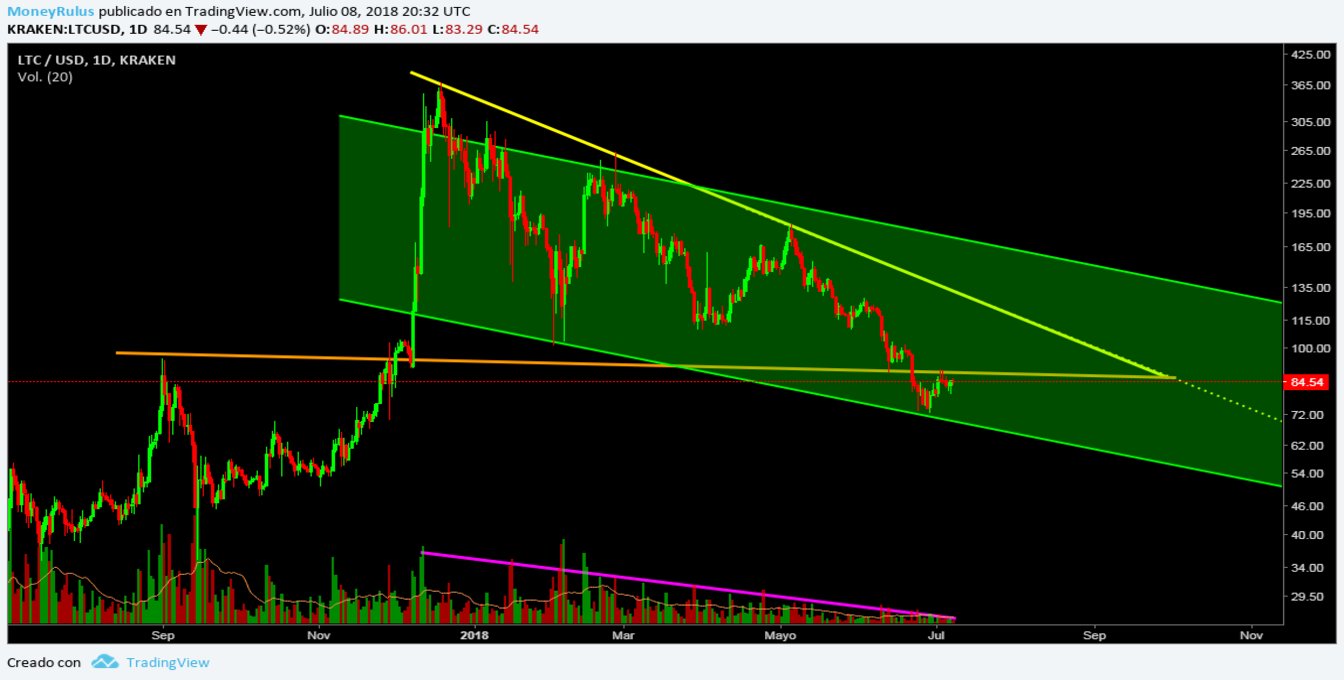
The technical analysis in the LTC / USD pair in the Kraken exchange house shows that the regression that was being made towards the long-term trend line – orange – lateral, is complete, so the price continued to fall in the direction and wanted to try to make a new absolute minimum, by the influence of the bears; on this occasion that was not possible and they only achieved a relative minimum which, although not insignificant, is not as significant as a new minimum.
If the price continues to fall, can go to the bottom of the channel – green – in the medium term descending, an area that can be a potential support in view of the fact that bulls often use those areas to greatly increase the purchase pressure.
If this is not the case, it is possible that the price is redirected to the area where the Pull back has just been made, in the orange trend line.
The trend line – yellow – descending in the medium term, is still valid, but is a bit far from the price, so it is silent until now.
The volume continues to decrease as time passes and the price tends to fall, for a long time the price was very lateral, but after breaking that laterality downward, the volume remains in energy saving mode, as happens with many other coins, in which the force seems to have vanished little by little.
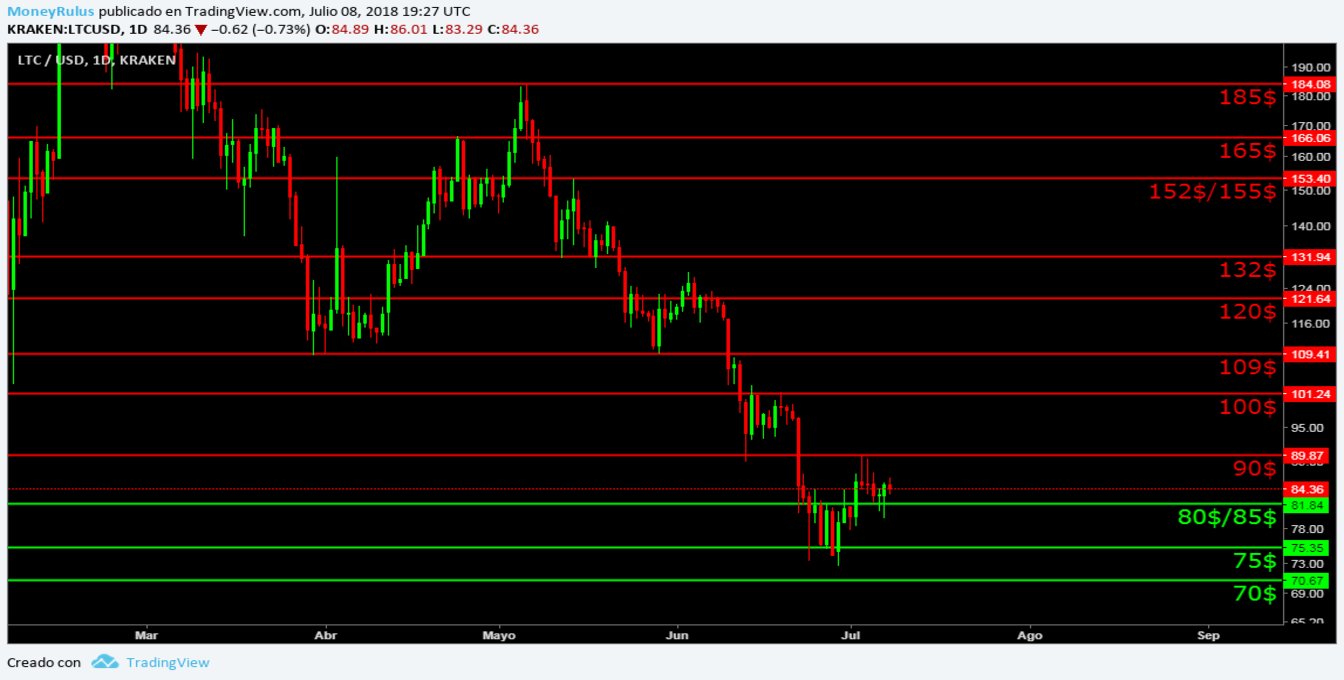
- The bears can set a resistance of $ 80 / $ 85, $ 90 (the last bastion they conquered) and $ 100.
- The bulls, by doing the same, can create supports at $ 75, $ 70 and $ 67.
Technical analysis Cardano, ADA / USDT
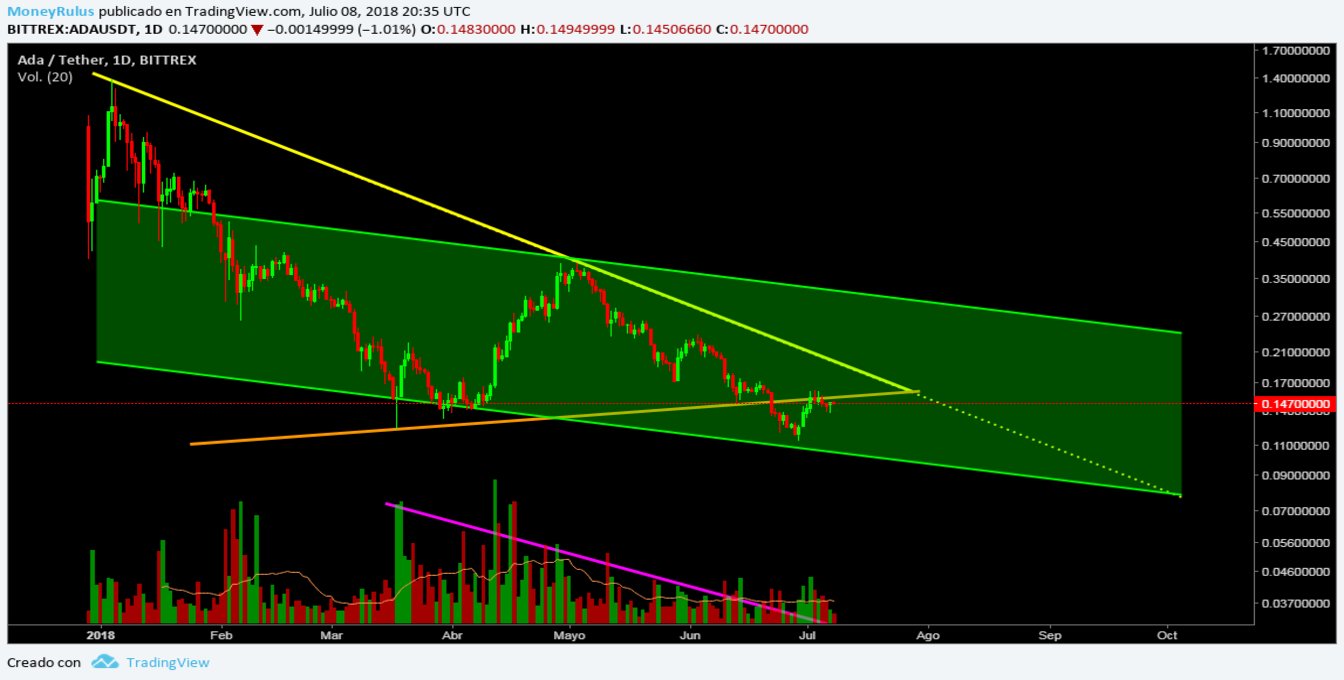
The ADA / USDT pair in the Bittrex exchange house shows that the long-term trend line – yellow – downward, remains valid although distant from the price, a few weeks have passed that it does not touch the resistance, but with the volatility of this market , the ideal is to keep it in mind even if it seems forgotten.
The price is within the channel – green – of medium descending, near the middle part of it, although a little more contiguous to the lower part, than to the upper part.
At this moment, it seems to be receding for a second Pull back to the area where the trend line – orange – rises in the medium term, an area in which the price has already encountered resistance in the past, so it remains. It is possible that the bears take control in that area to lower the price and try to make a new minimum.
The volume is low, something to which we are already accustomed, but with which we must remain very attentive, the lack of strength is not a good sign, so it is better to sleep with one eye open.
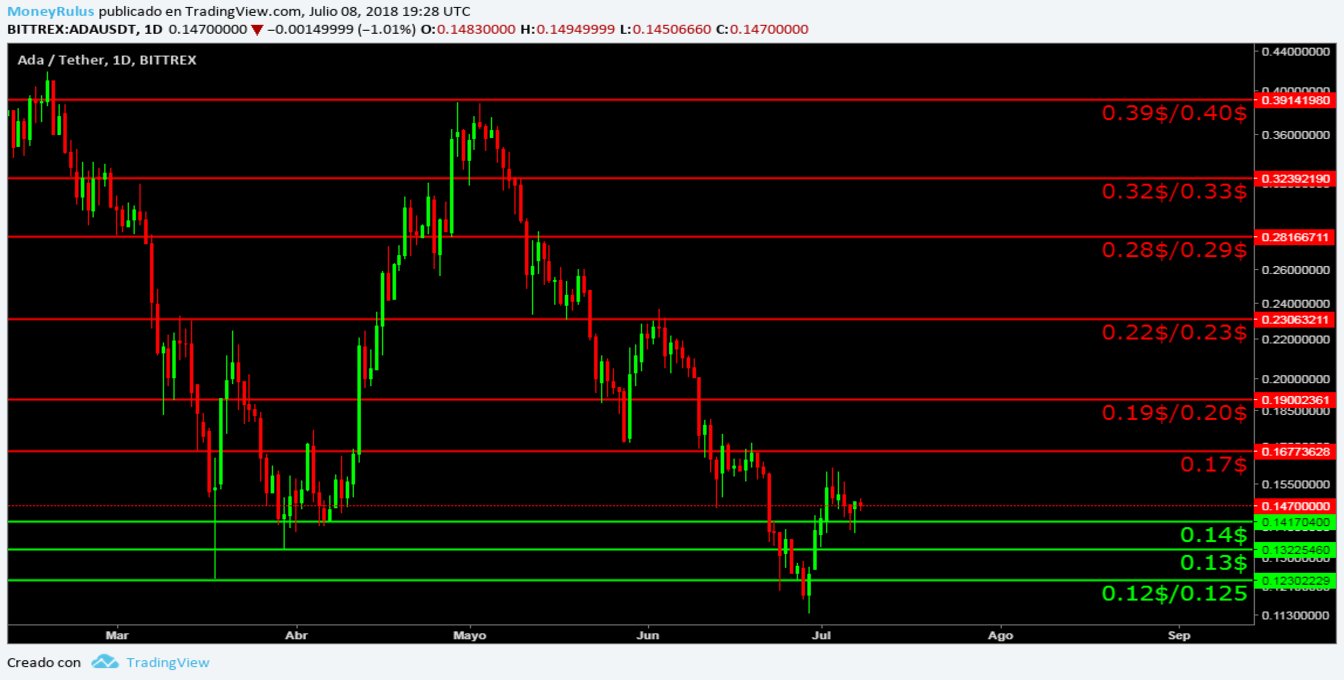
- Bears can show resistance in the area of 0.17 $, 0.19 $ / 0.20 $ and 0.22 $ / 0.23 $.
- And the bulls can form supports in the areas of 0.14 $, 0.13 $ and 0.12 $ / 0.125 $.
Technical analysis Stellar Lumens, XLM / USD
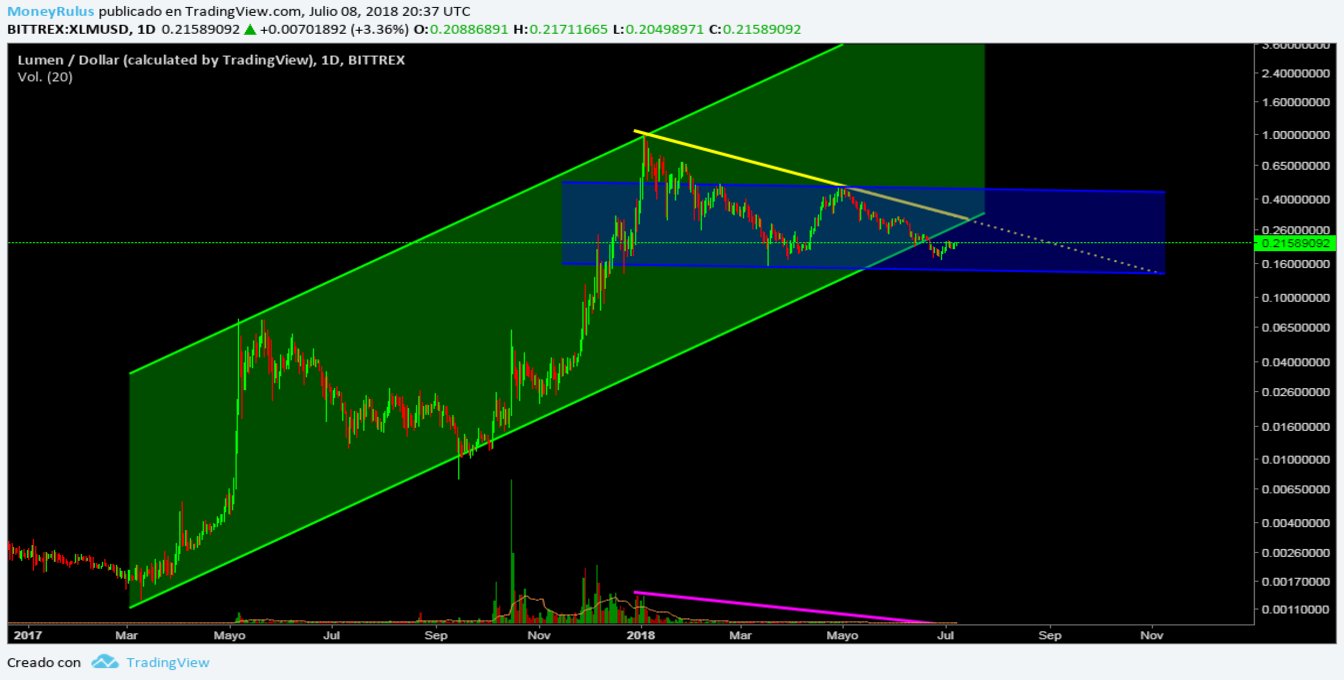
The pair XLM / USD in the exchange house Bittrex shows that the trend line – yellow – down medium term, is still valid, although a little away from the price, like others that we have seen during the analysis, is understandable that the market for some time is very bearish, so it moved away from that area because of the strong influence of bears.
The price just bounced a few days ago, in the lower part of the channel – blue – horizontal medium term, which has served as a support on several occasions, with this it has happened 4 or 5 times in a period of a month.
It is important to understand that the price at this time, may be heading towards the upper part of the blue channel, to try to touch the yellow trend line of which we have already spoken.
The price remains outside the channel – green – rising long term, so for now it is still a possible resistance.
The volume is practically invisible, this is a clear sign of weakness that does not generate confidence in any way, it seems that one has to be careful with the small volume that the market shows, with this currency it may be a good idea to duplicate that precaution , because the force is literally “null”.
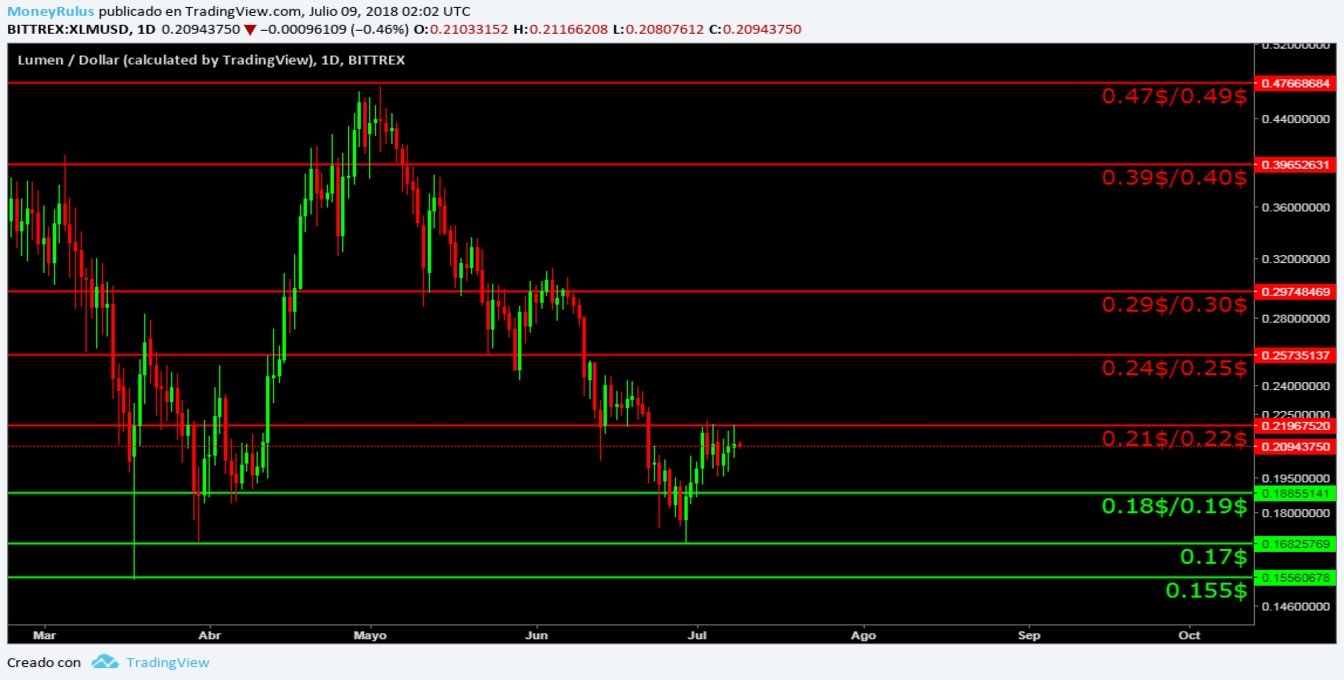
- Bears can build resistances at 0.24 $ / 0.25 $, 0.29 $ / 0.30 $ and 0.39 $ / 0.40 $.
- And bulls can do the opposite, in the 0.21 $ / 0.22 $, 0.18 $ / 0.19 $ and 0.17 $ zones.
Technical analysis IOTA, IOTA / USD
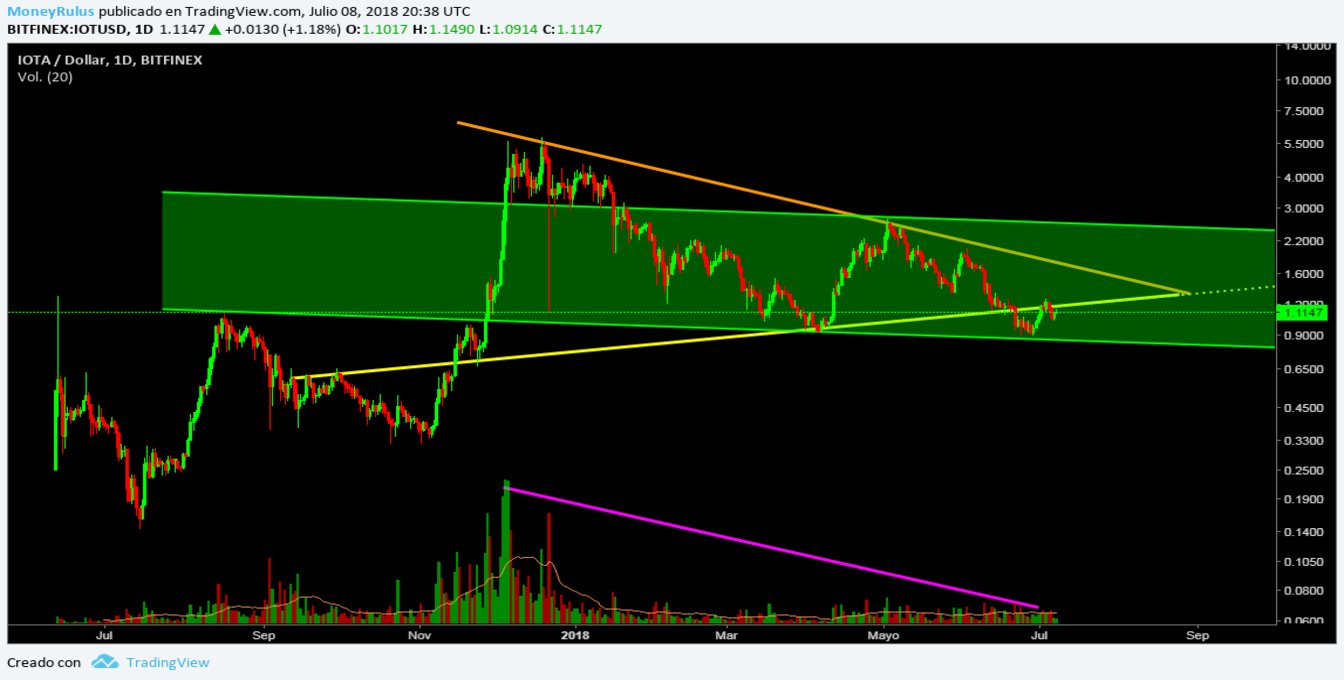
The penultimate technical analysis is for the pair IOTA / USD in the BitFinex exchange house, which shows that the price has already culminated a Pull back that last week was going towards the area that dominates the trend line – yellow – upward term, this area is a strong resistance, after the bears took control of it when it was a support, so if it tries to go back to the same strip, it is possible that the sales pressure causes the price to fall as it already has it in the past.
Recently, the price bounced near the bottom of the channel – green – slightly downward in the medium term, which so far has served as support on several occasions, so it seems to be a zone of domain of the bulls.
The volume is timidly shown, but at least it is shown, so that a certain amount of force still persists in the currency, little, but present.
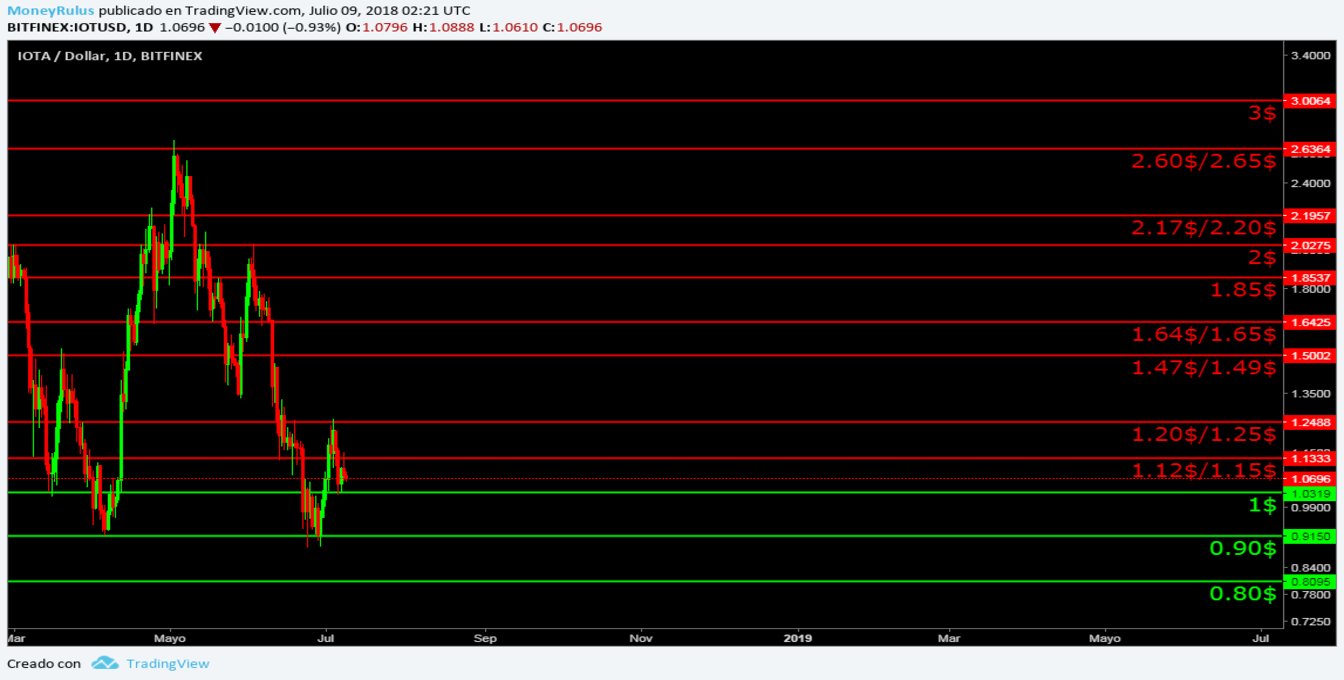
- The bears can generate resistances in the area of $ 1, $ 1.12 / $ 1.15 and $ 1.20 / $ 1.25.
- While the bulls on their side can find supports in the bands of 0.90 $, 0.80 $ and 0.72 $.
Technical analysis Tron, TRX / USD
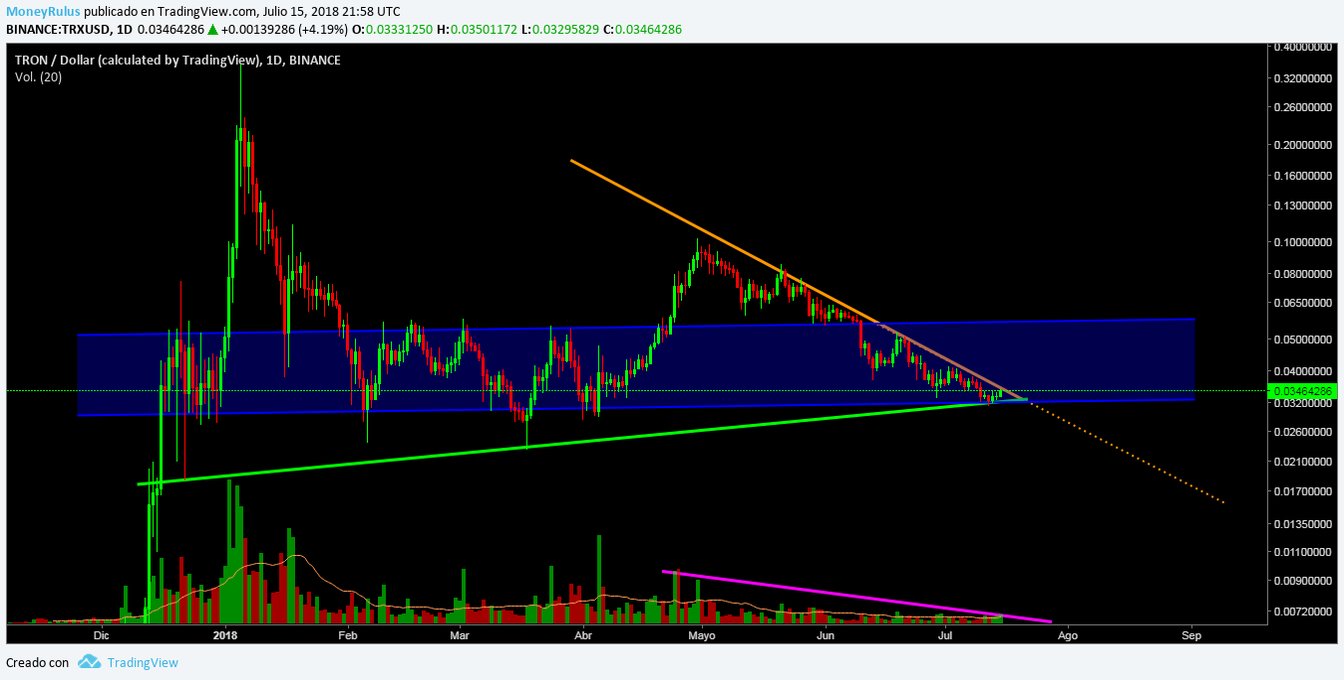
Finally, let’s look at the last pair (which displaced NEO, to regain its position again), TRX / USD at the Binance exchange house; what the currency shows is interesting, first of all that the price is respecting the trend line – orange – descending medium term, which has been a strong resistance for some time.
Similarly, the price is on the trend line – green – rising long term, which has served as support on numerous occasions, this increases the possibility of doing it again, although the ideal is to wait for confirmations, to see the direction you want to take the market.
In addition to the already mentioned, the price is also within a channel – blue – lateral medium term; It is located precisely in the lower part of it, so it is possible that if it bounces, go to the upper part of the blue channel.
It is important to keep in mind that the market must decide if it respects the support or resistance and based on that decision, follow a path. The price is lateral, within the green and orange trend lines, so it forms a certain (possible) very interesting symmetric pattern.
The volume is very low, demonstrating that the strength for now is very scarce, this contraction supports the possibility of the pattern, so it would make sense. Although it would be a good idea to stay very attentive, since the volume is getting smaller.
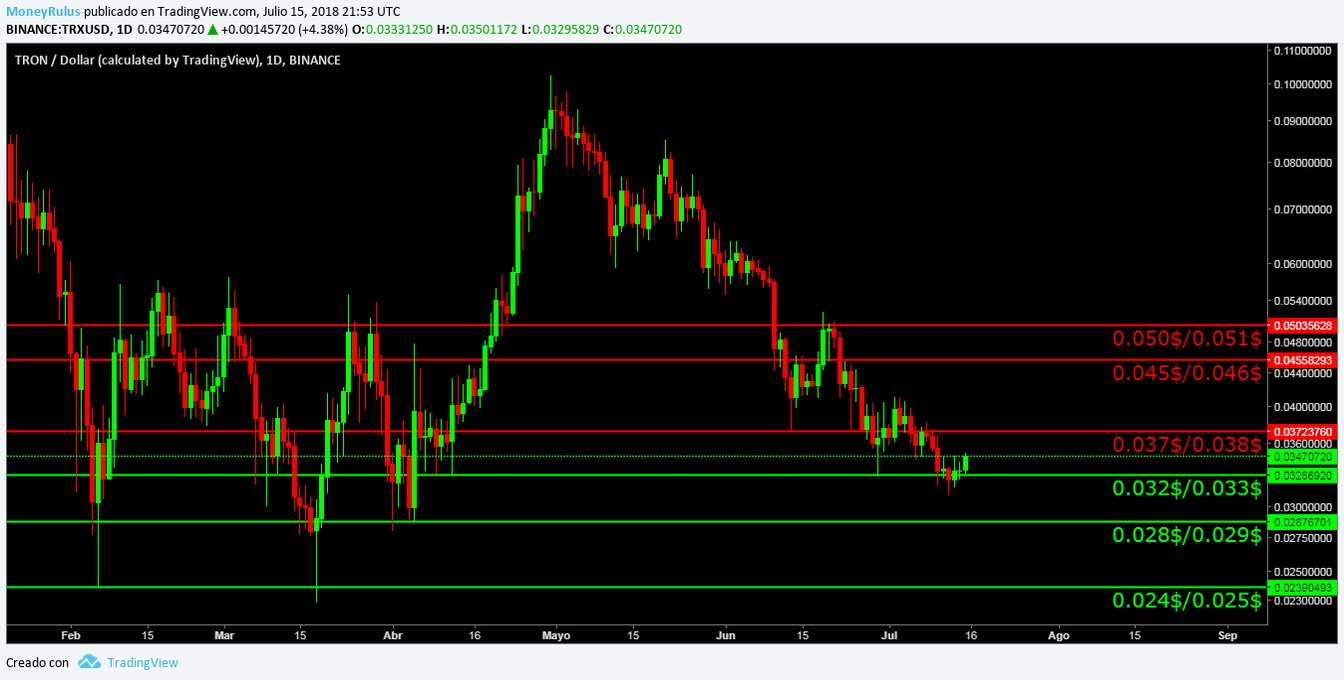
- Bears can increase selling pressure in some areas, and create resistance at 0.037 $ / 0.038 $, 0.045 $ / 0.046 $ and 0.050 $ / 0.051 $.
- Finally, the bulls can do the same, and form supports at $ 0.032 / 0.033 $, 0.028 $ / 0.029 $ and 0.024 $ / 0.025 $.