
How reliant the altcoin market is on Bitcoin has been evident in recent days. A single digit erosion-roughly eight percent—saw altcoins printing double digit losses as they basically dived to the dredges. Fact is, most are likely to print new 2018 losses.
All in all, it has been a rough year for BTC and with blurry regulations which saw Goldman Sachs putting off their initial plans of setting up a crypto trading desk, many are anticipating further losses towards the psychological $3,000 mark.
BTC Fundamentals
It’s no secret that sometimes, Bitcoin has to unnecessarily wade through murk. Often accusations—correct and otherwise, are from the Bitcoin Cash camp-who by the way are quickly marketing themselves as the bon a fide custodians of Satoshi Nakamoto protocol and calling themselves Bitcoin confusing newbies.
Roger Ver, the self-styled Bitcoin Jesus is the proponent of the latter and though they have their own internal wrangles, their assertion that Blockstream and core developers are charting a different course are audible. It’s getting loud and now Ripple executives have reasons to compare claiming that their network is now decentralized that Bitcoin’s thanks to their different consensus algorithm with low entry barrier and lack of validator rewards.
On their defense, they point to proof-of-work’s energy intensive consensus algo, high cost of entry and mining pools as reasons that the network is limited to a few companies effectively making it centralized, hard to scale and with low throughput. Cumulatively, this renders Bitcoin’s network inefficient as a medium of exchange as envisioned by the founder.
Aside from this, it’s common knowledge that the industry is still nascent and with shifting regulations, Goldmans Sachs appear to be temporarily backing out. Though they had boosted the BTC and altcoins markets by announcing plans of setting up a cryptocurrency trading desk, ambiguous regulatory frameworks and recent ETF denials combined by a sharp drop of crypto valuation did shake out their confidence.
Bitcoin (BTC) Technical Analysis
Weekly Chart
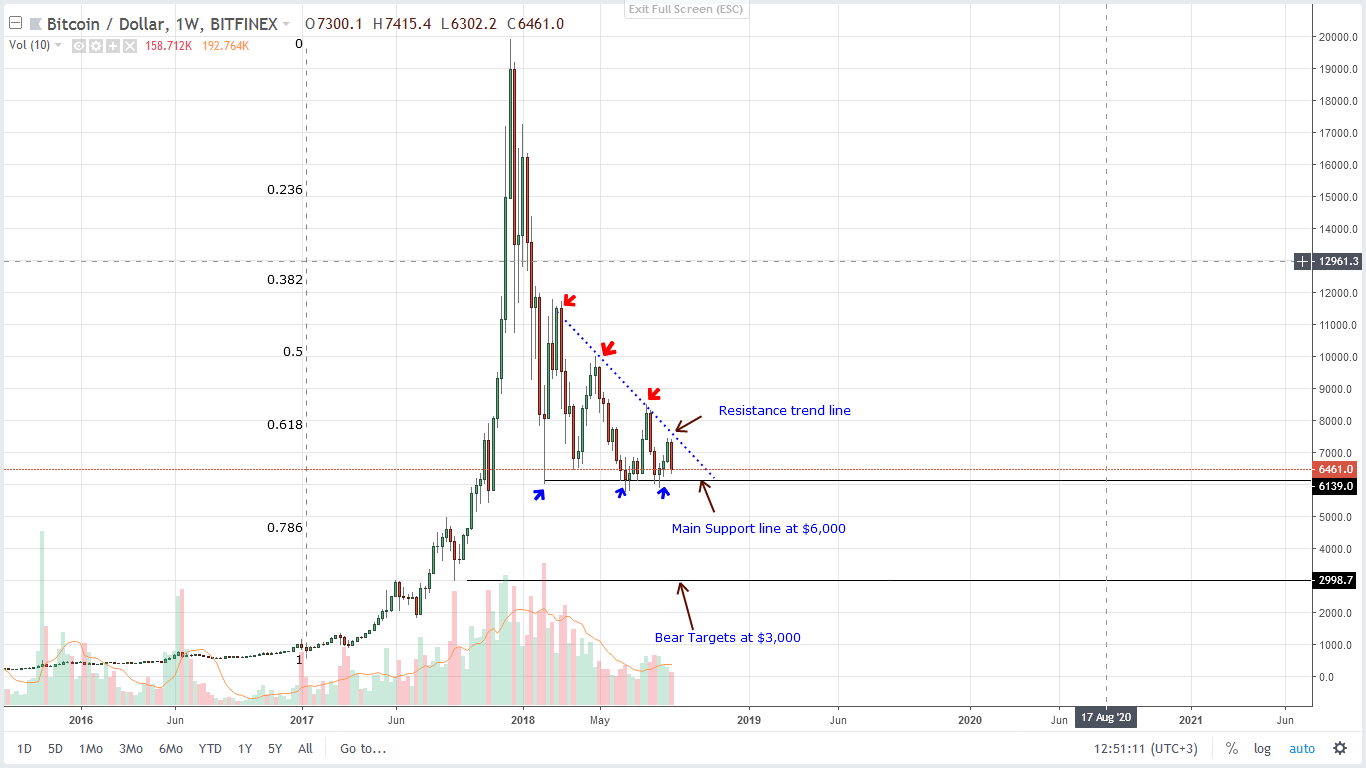 Our conservative expectation in previous Bitcoin trade plan was a confirmation of last week’s market buoying higher highs. However, that has not been the case and instead it’s a crashing drop from right the resistance trend line following Sep 5 events.
So far, statistics shows that prices are down seven percent from last week and with a dark cloud cover printing, BTC prices could retest the main support zone between $5800 and $6000 in coming days. Now considering the speed of this week’s capitulation and the high trade volumes driving prices from $7,000-$7,500 territory, we recommend selling on highs in lower timeframes.
Daily Chart
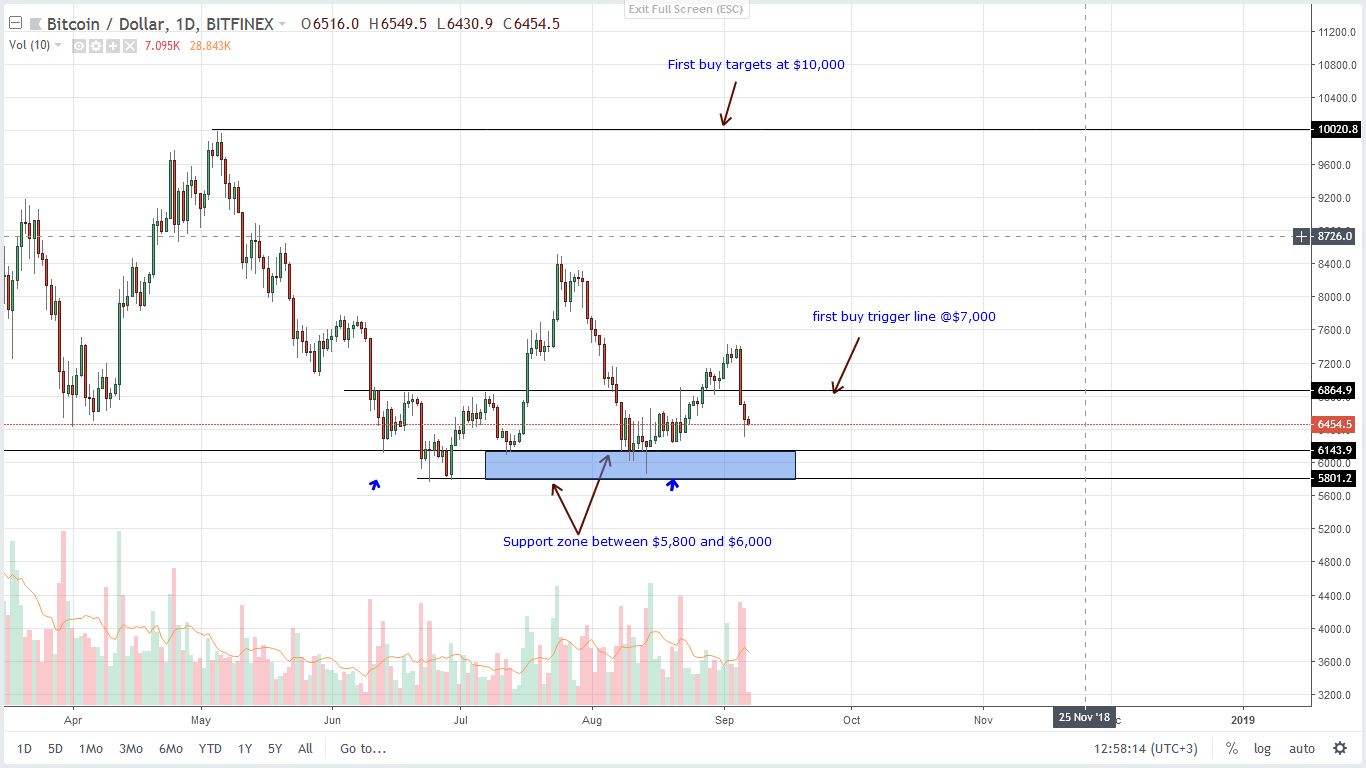 The collapse from $7,500 was rapid and deflating for traders expecting a confirmation in the course of the week. Instead, what we do have is a glaring double bar, dark cloud cover pointing to overvaluation. Coincidentally, the rejection did happen right at the resistance trend line in the weekly chart.
To avoid fading the general bearish trend and to tune in with momentum, we recommend selling at current prices with stops at$6,700—Sep 6 highs. First targets shall be at $6,000 and should there be a comprehensive collapse, $4,500 and later $3,000 would be ideal bear targets.
Disclaimer: Views and opinions expressed are those of the author and aren’t investment advice. Trading of any form involves risk and so do your due diligence before making a trading decision.