
Latest Bitcoin [BTC] News
Just to put things in perspective, Bitcoin [BTC] is performing dismally in the top 10. Though these losses are not as steep as altcoins, it is down 33 percent in the last month, 22 percent in the last week and four percent in the last day despite small-time support as buyers absorb sell pressure preventing prices from tumbling below $4,300, this year’s lows.
Now, as expected analysts are connecting this drop to the civil war between Bitcoin SV and ABC but even as they squabble over ideology, businesses who have built a fortune around cryptocurrencies and linking this space to the fiat world are registering massive losses.
A recent study by chainanalysis found that crypto payment processors as BitPay and Edmonton based Coinpayment are processing low volumes thanks to Bitcoin prices which is down +80 percent from 2017 peaks. After analysis 17 different processors, the firm found that incoming and outgoing crypto transactions—including those of BTC—whose details are patchy—is down 80 percent from $427 million in December, to $96 million by Q3 2018.
Built as a digital cross border currency that is censorship resistance and fast, BTC demand continue to dwindle as its prices capitulate. This nosedive is not only causing traders to hold as the stock market find their own demons of its own but miners as Giga Watt are experiencing cash flow problems while others have opted to phaseout inefficient gear as Antminer 7, Antminer 9 and AvalonMiner 741 deemed as too expensive to operate.
BTC/USD Price Analysis
Weekly Chart – Price prediction BTC/USD
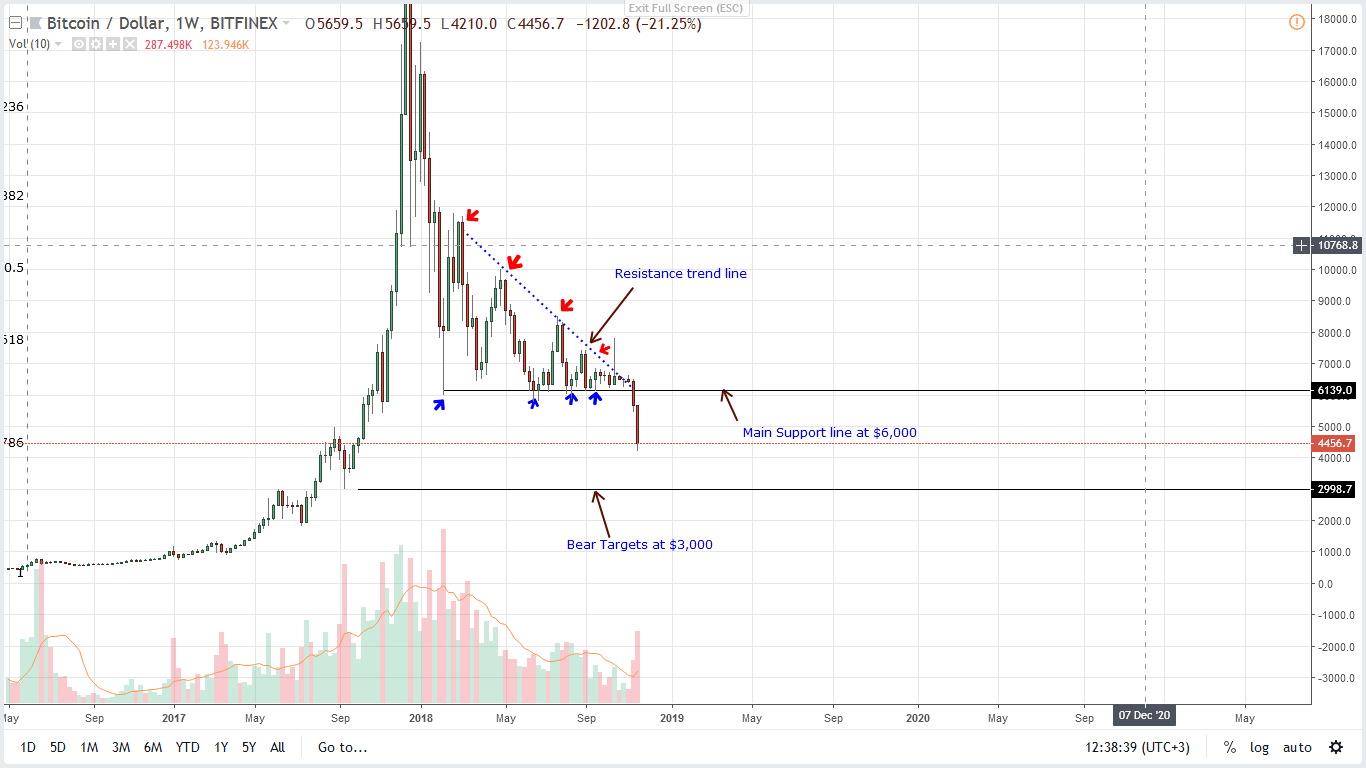 Still, BTC/USD is grappling with bears even from a top-down approach. From the chart it is clear that BTC is struggling against sellers and confirming last week’s bear bar that saw prices drop below the psychological support of $6,000 at the back of high volumes and abnormally high trading range—prices were down $1,600 in two days.
At spot prices, BTC is trading at our ideal level of support at $4,500 and we expect prices to recover towards $5,000 before sellers resume trade driving prices towards the second level of support at $3,000. All in all, it will largely depend on the strength of bears and how price will find support as this capitulation threaten to reverse 2017 gains.
Daily Chart – Price prediction BTC/USD
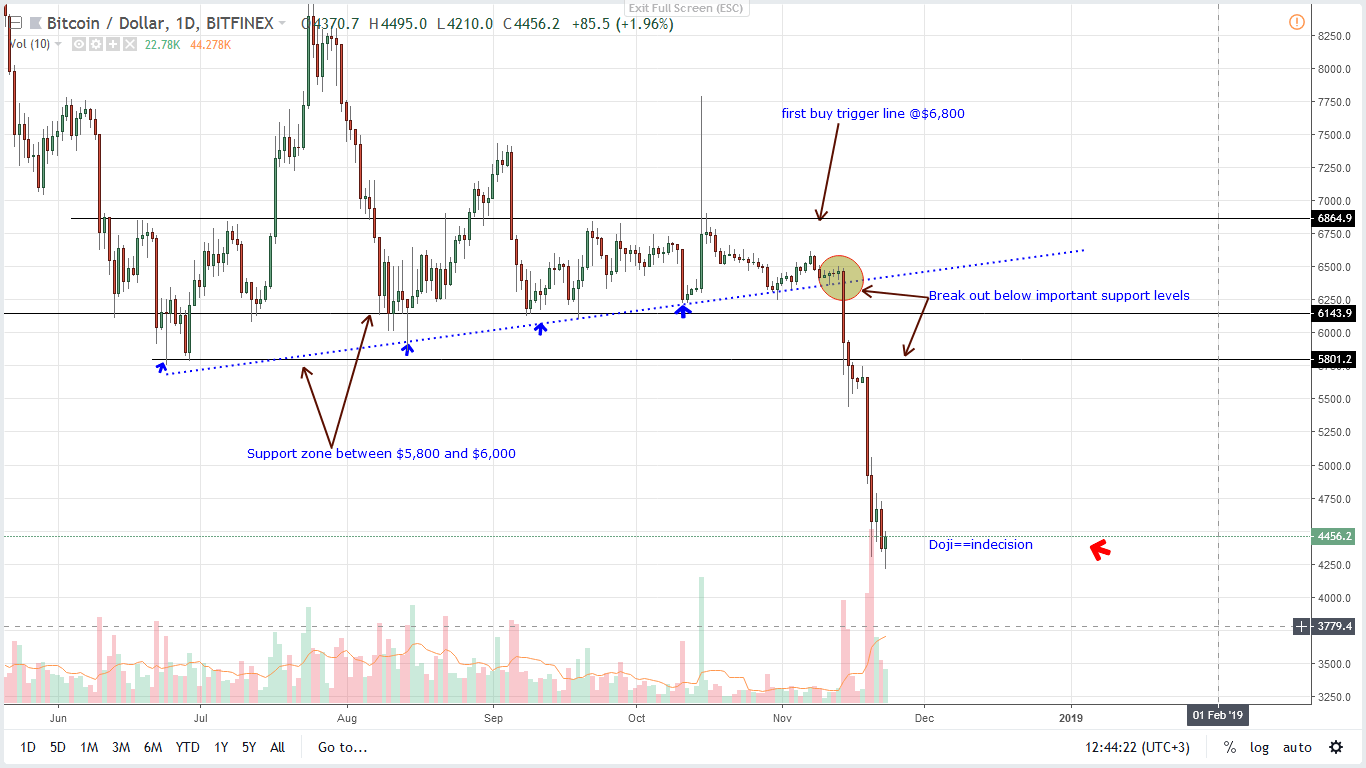 From candlestick alignment, it is likely that BTC/USD will recover, fading prevailing market conditions. But before that happens then we must see strong and convincing rejection of lower lows above $4,500 with buyers closing above Nov 23 highs of $4,700.
When this prints then aggressive traders can load BTC at spot prices with stops at $4,300 and first targets at $5,500. On the other hand, dips below $4,300 or Nov 20 lows could invite the next wave of sellers aiming at $3,000 as bear trend resumes.
All Charts Courtesy of TradingView
Disclaimer: Views and opinions expressed are those of the author and aren’t investment advice. Trading of any form involves risk and so do your due diligence before making a trading decision.