Latest Ethereum [ETH] News
Is this a mini-ice age expected to be the norm after Constantinople and immediate implementation of EIP 1234 where the number of ETH rewards will shrink from 3 to 2 in what has been dubbed “thirdening”? if that is not the case, then there should be another rational, evident backed and logical explanation to explain a rather sharp decline in the number of ETH mined in the last few days.
Data from Etherscan shows that the difficulty level rose and consequently, limiting the number of blocks solved as the number of daily rewards took a plunge from 16,023 ETHs registered on Jan 5 to 12,819 ETHs of Feb 12.
Although the general consensus amongst miners is to postpone the activation of Difficulty Bomb by another year as the network slowly transit from the current energy demanding proof of work consensus algorithm to Serenity where it is the general expectation that Ethereum shall scale and process millions of transactions, the are obvious obstacles along the way.
The most obvious ones are technical hitches of the last three attempts where not only were developers disappointed but the Ethereum network temporarily split. This was so because the Ethereum Foundation couldn’t communicate the possibility of a re-entrance attack to owners of nodes who had already upgraded in readiness for a successful software upgrade.
ETH/USD Price Analysis
 While miners are readjusting and pocketing low rewards as network’s difficulty re-calibrate upwards, ETH bulls are back. The result has seen a boom as ETH prices expand, adding 15 percent in the last week alone. As if that is not enough, the coin is up 2.9 percent from yesterday’s close.
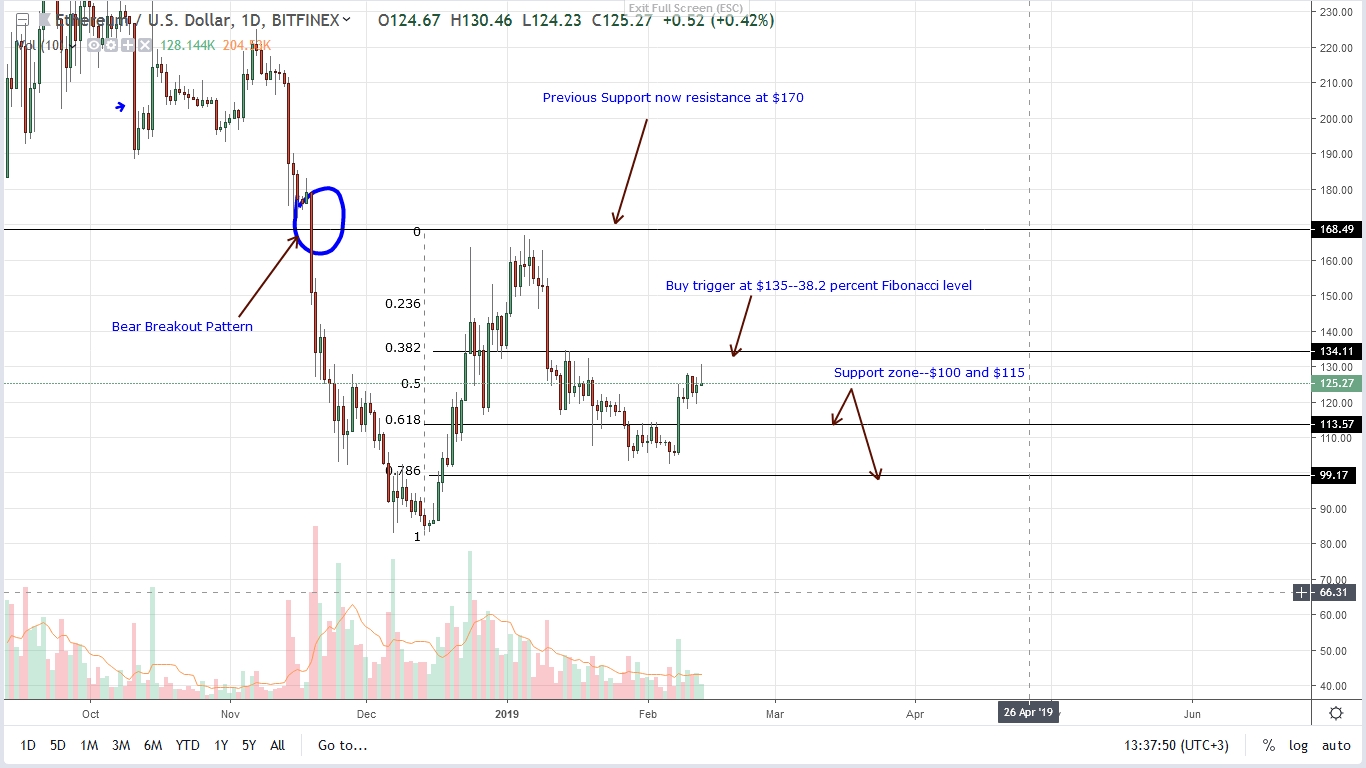
Because the coin is changing hands at $123 a pop, it is clear that our last ETH/USD price analysis is valid and prices are at long last bouncing off the psychological $100 mark. Going forward, we shall maintain a bullish outlook and with this projection, it is better to take a wait-and-see approach. In line with our last trade plan, there should be a high-volume break and close above $135—our minor resistance level and highs of the double bar bull reversal pattern of Jan 13-14.
Such an eruption will confirm bulls of Feb 8 while simultaneously correcting the divergence between mid-Jan and early Feb. Here, prices were dropping as volumes increased meaning there was a buildup of bull momentum which was eventually confirmed by Feb 8 price eruption off the 78.6 percent Fibonacci retracement level of Dec 2018 high low. Once our trade conditions are met, our first target will be $170 or Dec 2018 highs.
All Charts Courtesy of TradingView—BitFinex
Disclaimer: Views and opinions expressed are those of the author and aren’t investment advice. Trading of any form involves risk and so do your due diligence before making a trading decision.