
As the chart demonstrates, Cardano [ADA] has declined over the past seven days as its price moved from $0.04627 to the current $0.04189, representing a 9% general bearish motion.
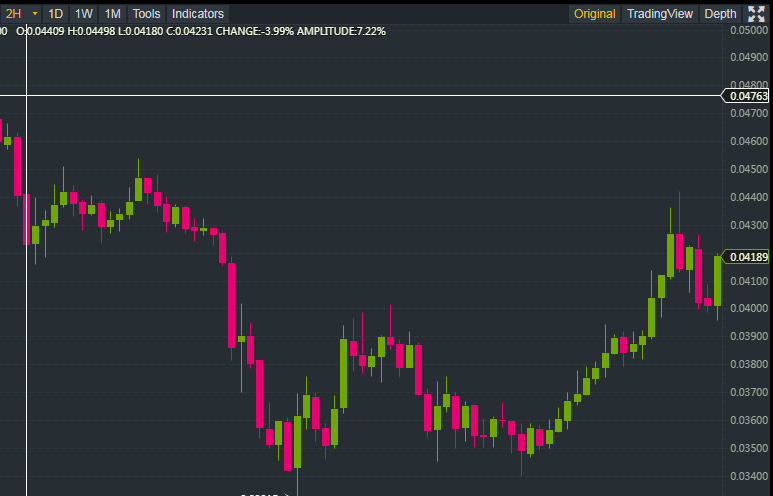 However, it is important to note that Cardano [ADA] has been on a bullish rally since the 27th of November at around 16:00, leaping from 0.03500 to the current price, which is also part of the current ongoing sideways movement at the aftermath of the bullish rally.
In fact, the past 24 hours have seen a positive 24 hour change currently placed at about 7%, as the 24 hour trading volume has improved to approximately 14 million USDT.
INDICATORS
BOLLINGER BANDS
 Currently, the Bollinger bands are exhibiting divergence or increased volatility since the beginning of the recent bullish rally.
As the chart shows, the trend line has now bounced off the upper boundary to approach the midline in a relatively sideways trend. Before the uptrend, the bands exhibited strong divergence and volatility starting from the 23rd which went along with the strong downtrend that took the price to the week’s low at $0.03315.
This was followed by a period of low volatility and sideways price movement evidenced by the classic Bollinger squeeze before embarking on the recent Bull Run.
RELATIVE STRENGTH INDEX (RSI)
 As shown above, the RSI trend line is currently approaching the oversold zone. The most recent oversold conditions were achieved yesterday on the 28th of November at around 20:00 as the price hit the $0.04181 mark before engaging on a short bearish trend which culminated in the current price. Another strong trend with reference to the RSI was seen on the 25th as the trend line hit the week’s low taking it to the weeks overbought zone.
MOVING AVERAGE CONVERGENCE DIVERGENCE (MACD)
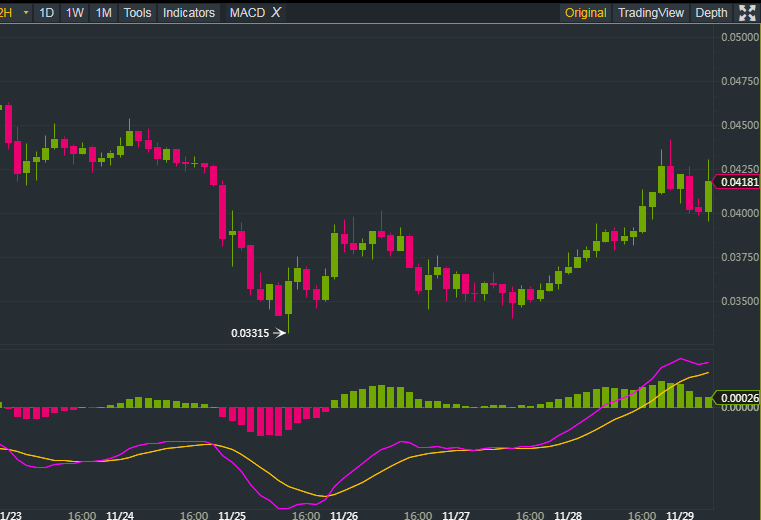 We are currently at the aftermath of a strong divergence of the moving averages with the faster moving average above the slower moving average. The histogram is also narrowing suggesting an aftermath of a strong bullish trend. Before the recent uptrend, the moving averages demonstrated previous crossovers which are consistent with a series of up and downtrends characterizing the week’s general price descent.
STOCHASTIC INDICATOR
Both moving averages are within the vicinity of the overbought zone with the faster moving average gaining some momentum in a bullish direction. This suggests a possible reversal in a bullish direction which might continue the upward trend which we have been witnessing in the past few hours.
Recent oversold conditions were seen at the peak of the recent bullish rally which ended at around 10 pm on the 28th. Beyond that the indicator has also been consistent with a series of highs and lows characterizing the week’s rather volatile price movement.
CONCLUSION
ADA’s price has seen a general decline just like most of other cryptocurrencies across the board. However, both HODLer’s and short term traders of the cryptocurrency have a good reason to be optimistic as the past two days have seen an encouraging bullish rally, making those who bought it in the period between the 25th and 27th expectant of some profit.
At this point in time, whether the recent bearish run is a long term furnace for cryptocurrencies or a tiny blip in an otherwise splendid future remains a mystery in most analytical minds.