
For a couple of weeks, the market has been falling sharply, at this moment the price of cryptocurrencies is in a flat or range trend (an absolute absence of trend in which the price is flat) after the side of the bears cornered the bulls side, until they beat them and achieved, in several cases, to make new minimums, whether it is absolute or relative.
It is understandable that this laterality takes place now, since the market is resting from all the effort involved in such a collapse, so we must be aware of this and be prudent, since at times like this, traps can appear more frequently.
The most advisable in moments of a range trend like this is to remain calm and not succumb to fear. Both the FUD and the FOMO can be very harmful for any trader or analyst, so the most reasonable thing in this type of situation is to stay still. But be careful, to be still and do nothing is two different concepts, this is a great moment to reflect, organize, study and learn.
Bitcoin, BTC / USD
For weeks, the currency has made new lows, both absolute and relative. The bears had full control of the market, they managed to push prices down to levels that at the beginning of the year seemed totally unsuspected, something that is really shocking.
The bulls, on the other hand, were completely cornered and could not stop the strong attacks of the bears, so for some weeks, the level of forces was similar to the attack between the Spartan army (the bears) against a hardened herd of Boy Scouts (the bulls); a duel in which clearly the bears had greater strength and in itself, the advantage.
At this moment, both sides are resting, after a bloody contest in which the bears managed to conquer new lands, but, not without leaving on the way some comrades.
On the other hand the bulls do the same, although from time to time, they try to retake control of the market, without success, of course.
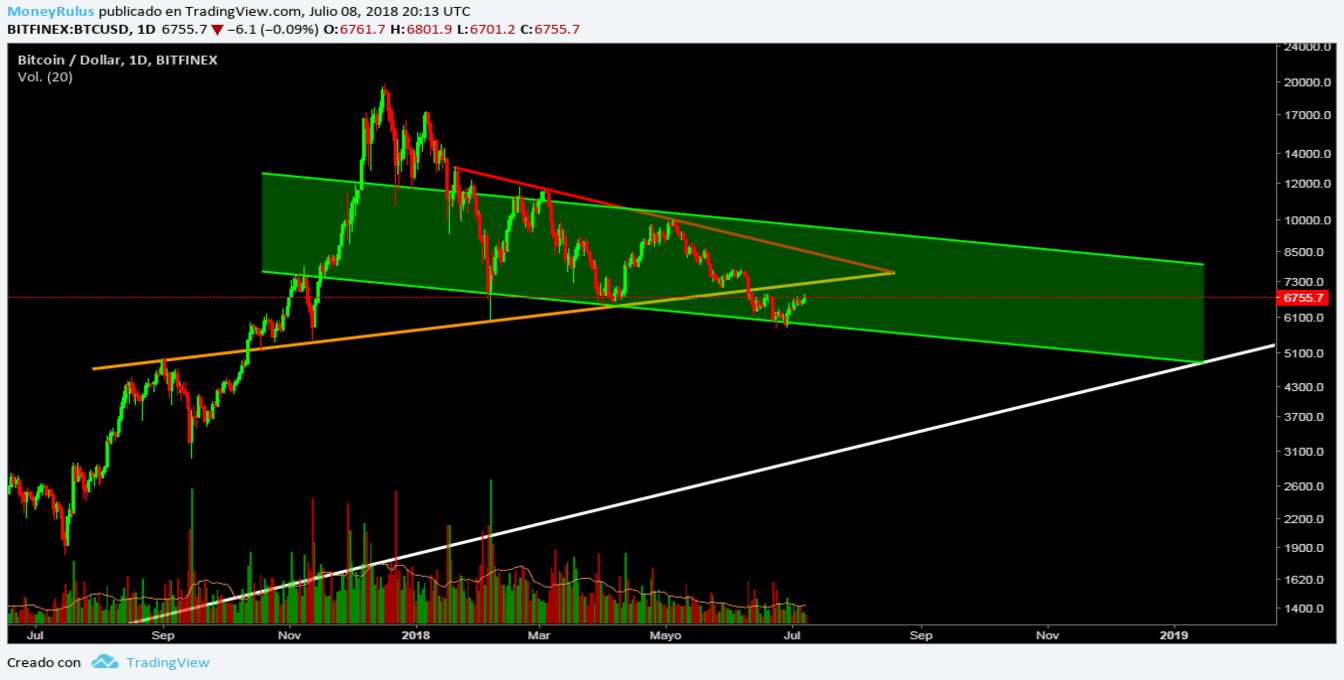
Observing the BTC / USD pair in the BitFinex exchange house, several interesting things are appreciated.
The first of these is that the price can tend to the upward trend line – white – long term, this line has been respected for more than 2 years and a half, which is of great value to determine the primary trend of the currency, which is why it makes sense to believe that in view of the current situation, it could become an important support.
In the same order of ideas, an important support that was broken was the line of upward trend – orange – medium term, which has become a strong resistance from more than 3 weeks, which can be of value for the bears, at the time that the bulls try to take control of the market.
The downtrend line – red – medium term, is still very well respected, so it can also be of value. Paying attention to the last relative minimums and maximums that the currency has been doing, we can see that a – green – medium-term descending channel is formed, a channel that is valuable since it may be one of the ways in which the price would tend to the trend line – white – long term, if it does not want to do it in a brusque and impetuous way.
The volume remains low until now, a sign of rest itself or lack of strength per se, only time will tell.
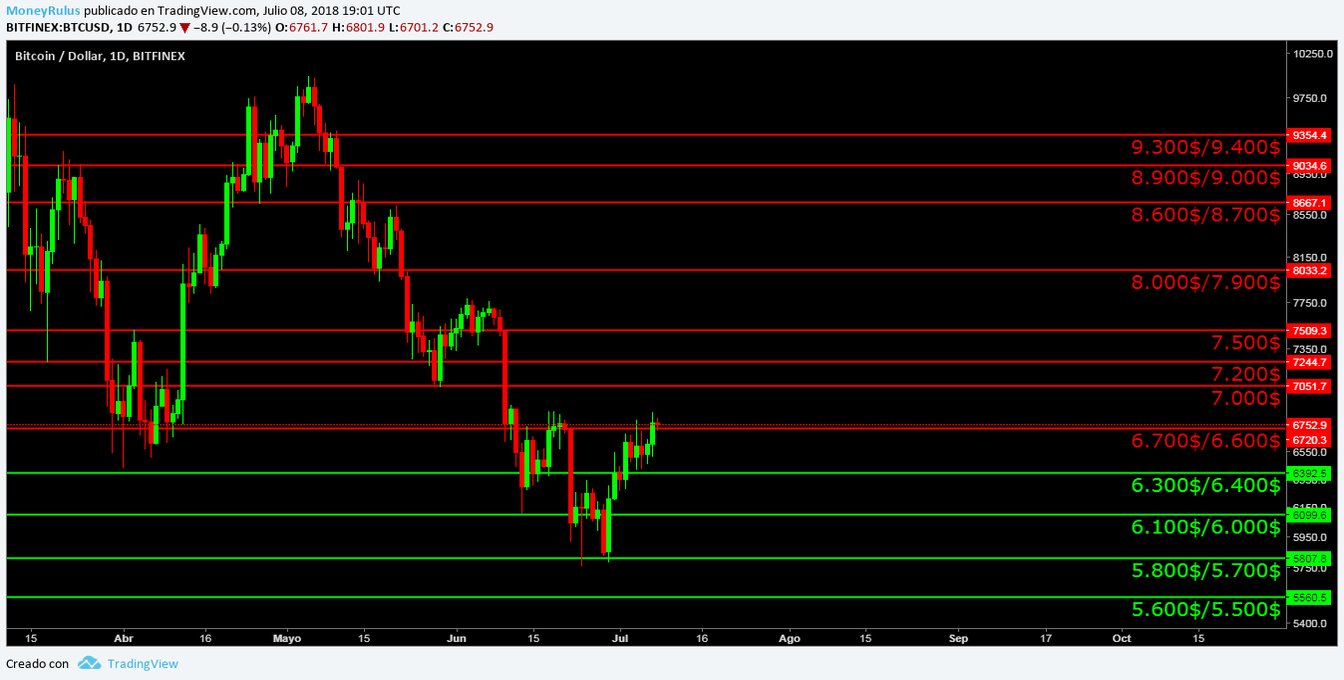
- Bears can create significant resistances in the $ 6,700 / $ 6,600, $ 7,000, $ 7,200, $ 7,500, $ 8,000 / $ 7,900, $ 8,600 / $ 8,700, $ 8,900 / $ 9,000, and $ 9,300 / $ 9,400 areas.
- On the other part, bulls can form supports in the areas of $ 6,300 / $ 6,400, $ 6,100 / $ 6,000, $ 5,800 / $ 5,700 – the absolute minimum – and $ 5,600 / $ 5,500.
Ethereum, ETH / USD
Ethereum (ETH) on the other hand, is much more stable than BTC, in this currency the bears failed to make new absolute minimums, although there was premiere of relative minimums.
The side of the bears does not have the strength it has in Bitcoin, which is understandable. This fact added with a greater resistance from the bulls, creates a formula in which the currency falls, but does nothing really surprising.
Even so, underestimating the strength of the enemy can be a very expensive mistake, so it seems that bulls should not be trusted with what happens, one has to be very attentive, because from one moment to the next, many things can change.
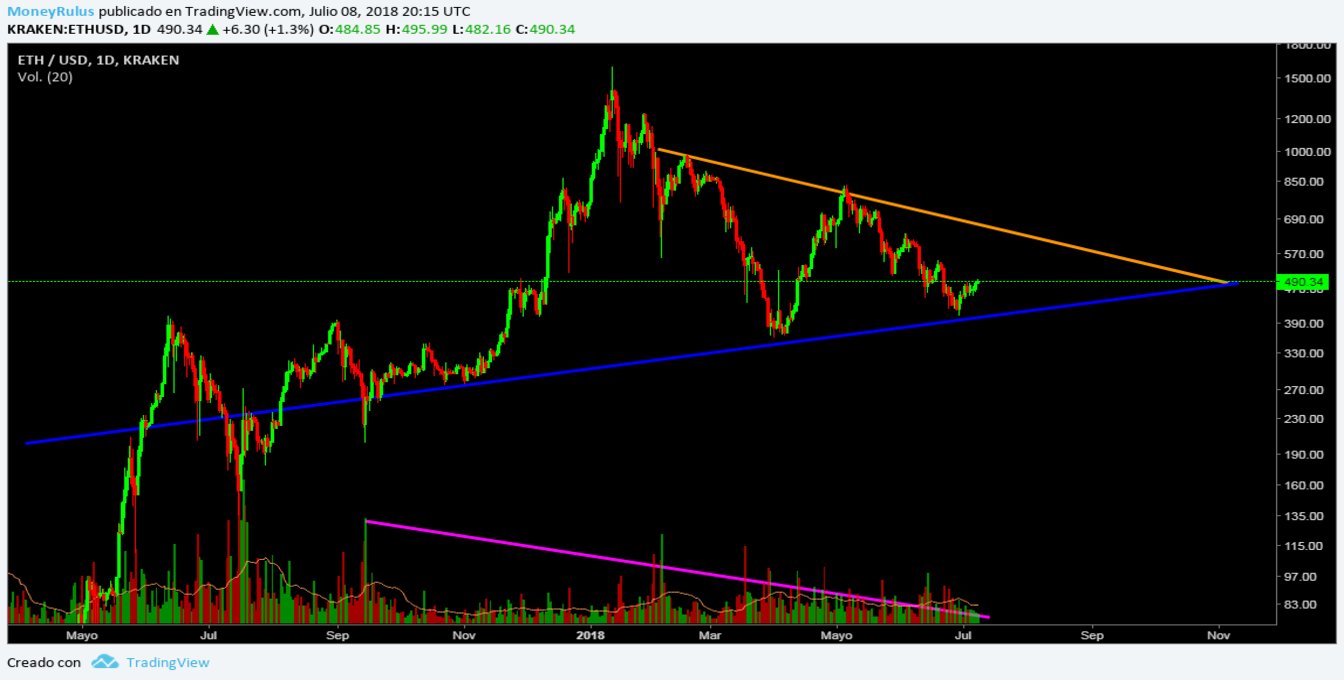
The ETH / USD pair at the Kraken exchange house shows us something more minimalistic. The upward trend line – blue – in the medium term, remains a strong support so far, which may be useful in the future.
In addition to that, the downward trend line – orange – medium term, remains as a great resistance, which also remains valid until now. As both trend lines remain valid, the price is increasingly lateral, in a possible symmetrical triangle – continuation pattern – long term. The volume has been contracting since the beginning of the pattern, so until now supports itself.
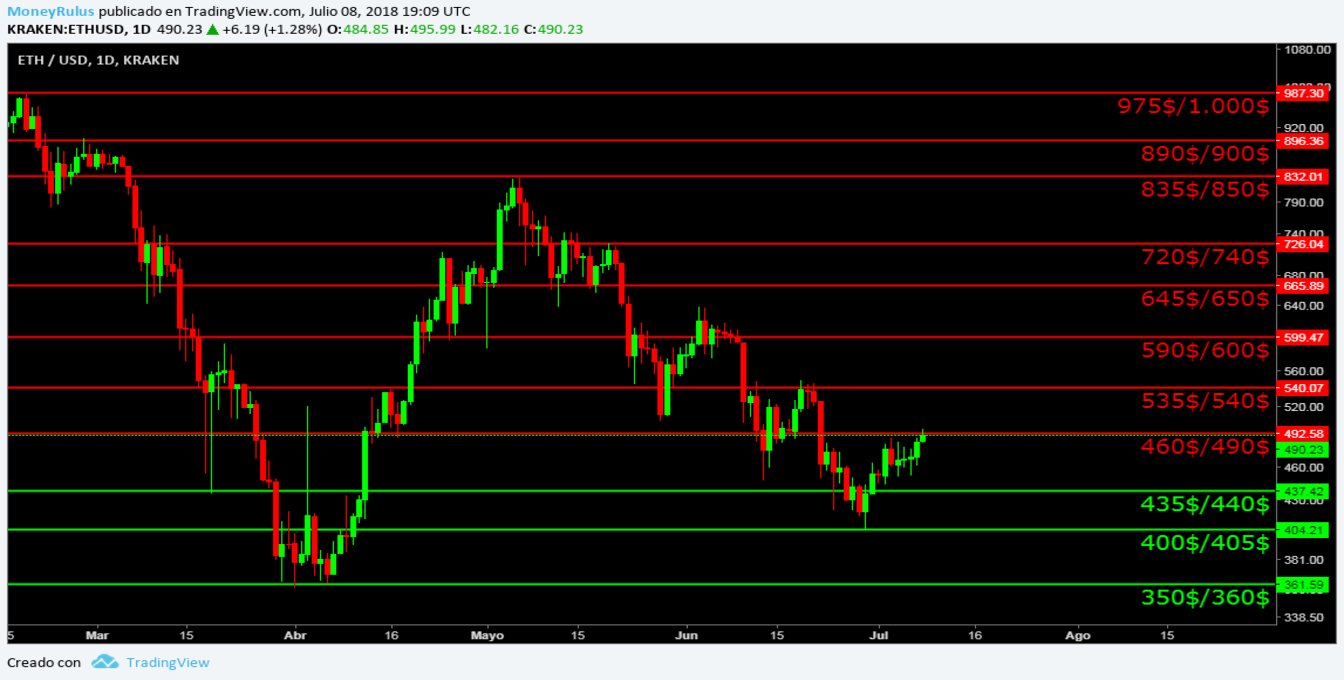
- Resistances can be found in the areas of $ 460 / $ 490, $ 535 / $ 540, $ 590 / $ 600, $ 645 / $ 650, $ 720 / $ 740, $ 835 / $ 850, $ 890 / $ 900 and $ 975. $ / 1,000 $.
- And supports in the areas of $ 435 / $ 440, $ 400 / $ 405 and $ 350 / $ 360.
Ripple, XRP / USD
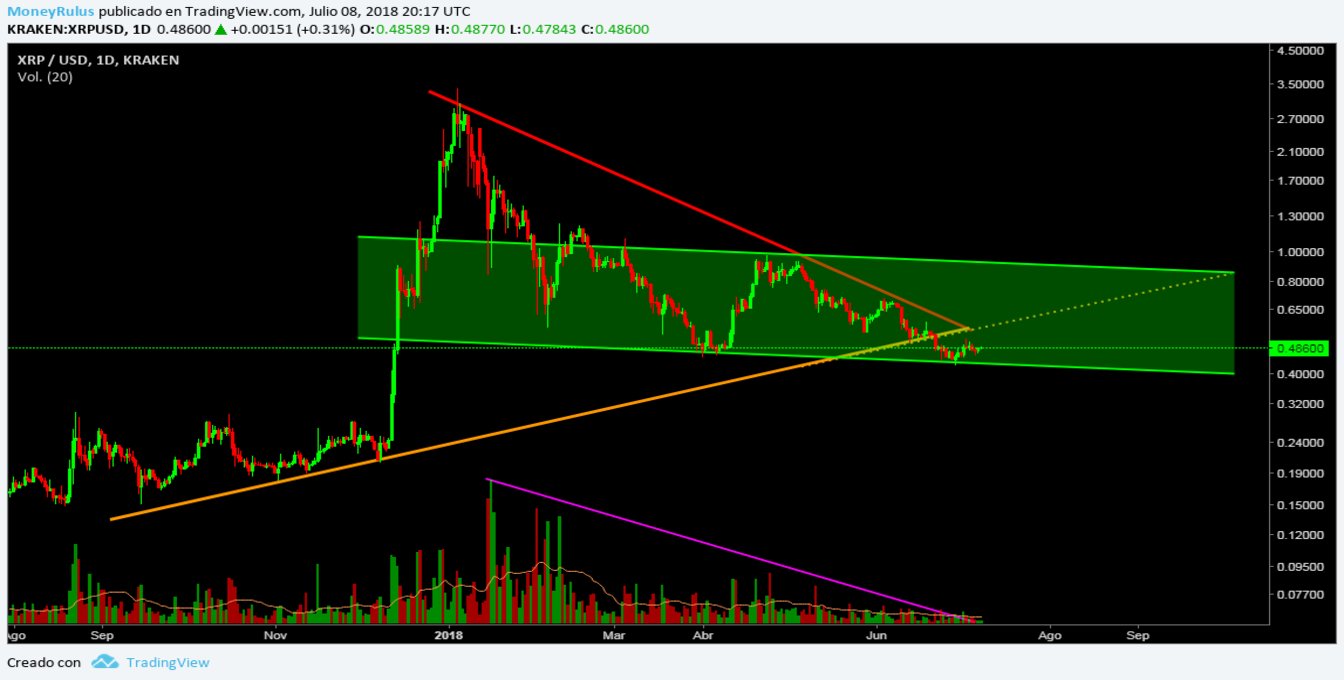
The pair XRP / USD in the Kraken exchange house shows how the line of upward tendency – orange – of medium term was broken, before it was a support, reason why now it has happened to become an important resistance (as long as it is not a trap, which seems possible but unlikely, since the Pull back was made).
In turn, the downward trend line – red – medium term, remains with its role of resistance, so far, which shows strength. The price for a long time was gradually lateralized (both between both trend lines, and within the green channel – medium term), until recently the market broke this laterality without apparent support of the volume, so it is considered that that movement, did not have a really extraordinary force.
At this moment the volume is particularly low (after falling as the price became increasingly lateral), so you can sense a certain reluctance in the pair. Still, it can be interesting to be attentive to any relevant event.
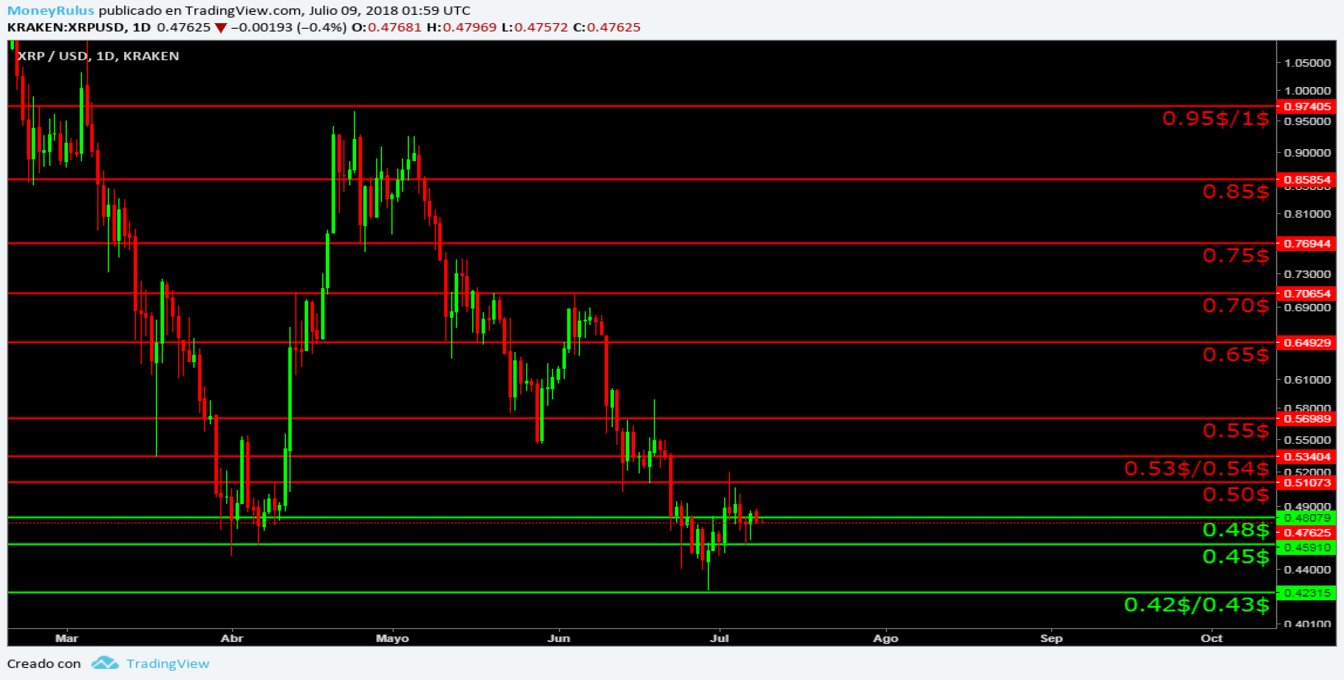
- The side of the bears can create resistances in the areas of 0.50 $, 0.53 $ / 0.54 $, 0.55 $, 0.65 $, 0.70 $, 0.75 $, 0.85 $ and 0.95 $ / 1 $.
- The bulls can do the same and create supports at $ 0.48, $ 0.45 and $ 0.42 / $ 0.43.
Bitcoin Cash, BCH / USD
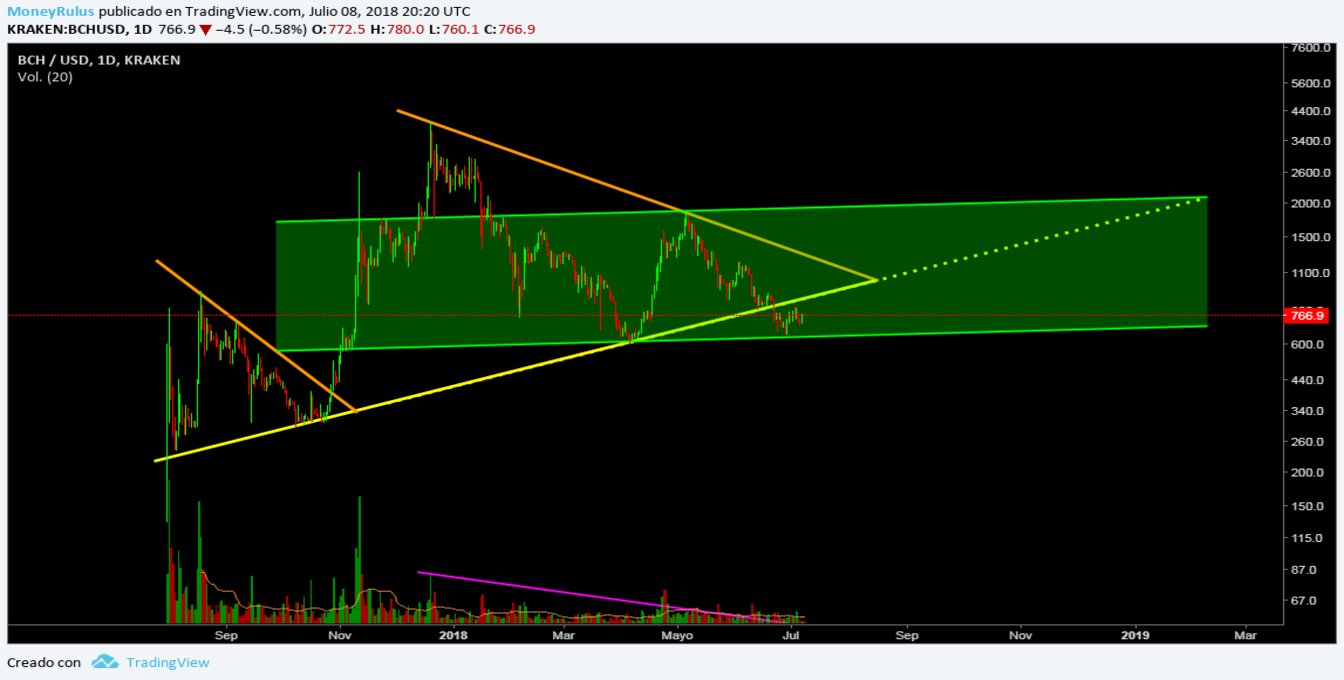
Looking at the BCH / USD pair at the Kraken exchange house, we note that the long-term rising trend line – yellow – has been broken and has become a strong resistance after having been an important support in the past. Besides that, the downward trend line – orange – medium term, remains as a valid resistance until now, so it is vital to take it into account.
As with the XRP / USD pair, the price has been lateral for some time, since first it was with the triangular pattern that we already know to continue with the slightly bullish channel – green – medium term.
The volume is low, supporting laterality and demonstrating a certain lack of strength, a force that, clearly at this moment, only seems like a legend, a ghost of the past.
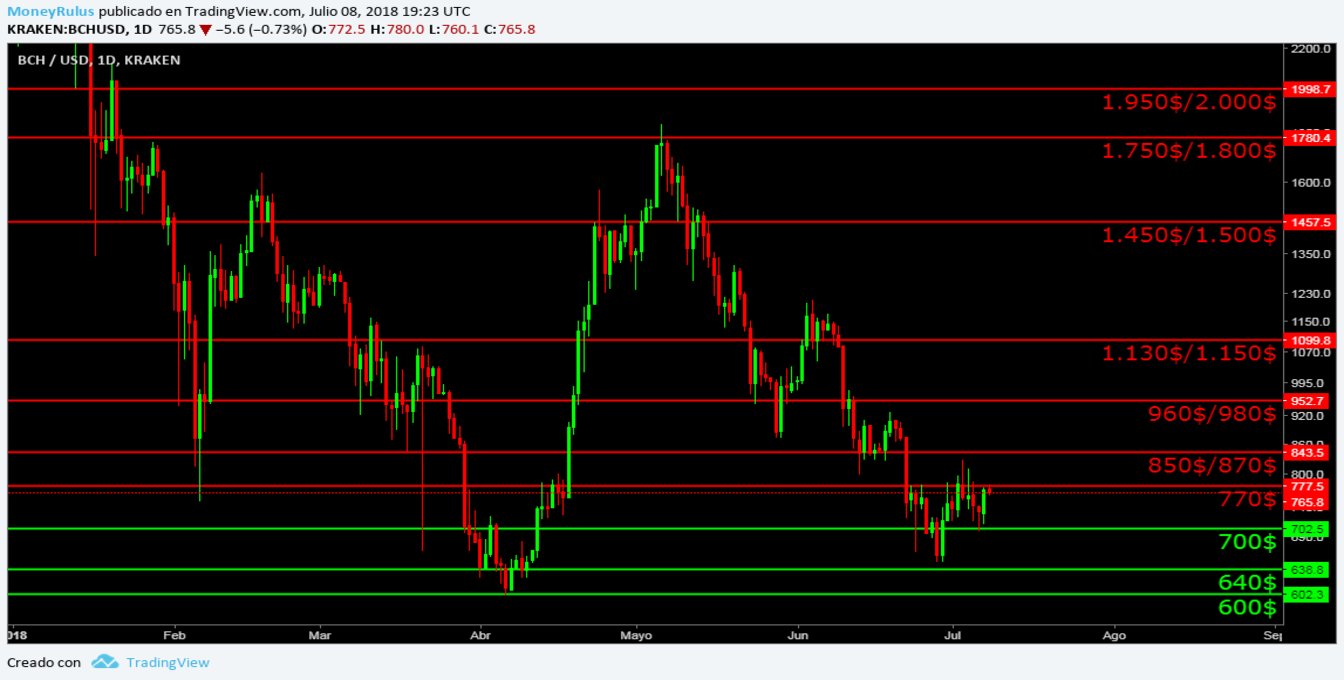
- The bears can find resistance at $ 770, $ 850 / $ 870, $ 960 / $ 980, $ 1,130 / $ 1,150, $ 1,450 / $ 1,500, $ 1,750 / $ 1,800, and $ 1,950 / $ 2,000.
- Also, bulls can form supports close to $ 700, $ 640 and $ 600.
EOS, EOS / USD
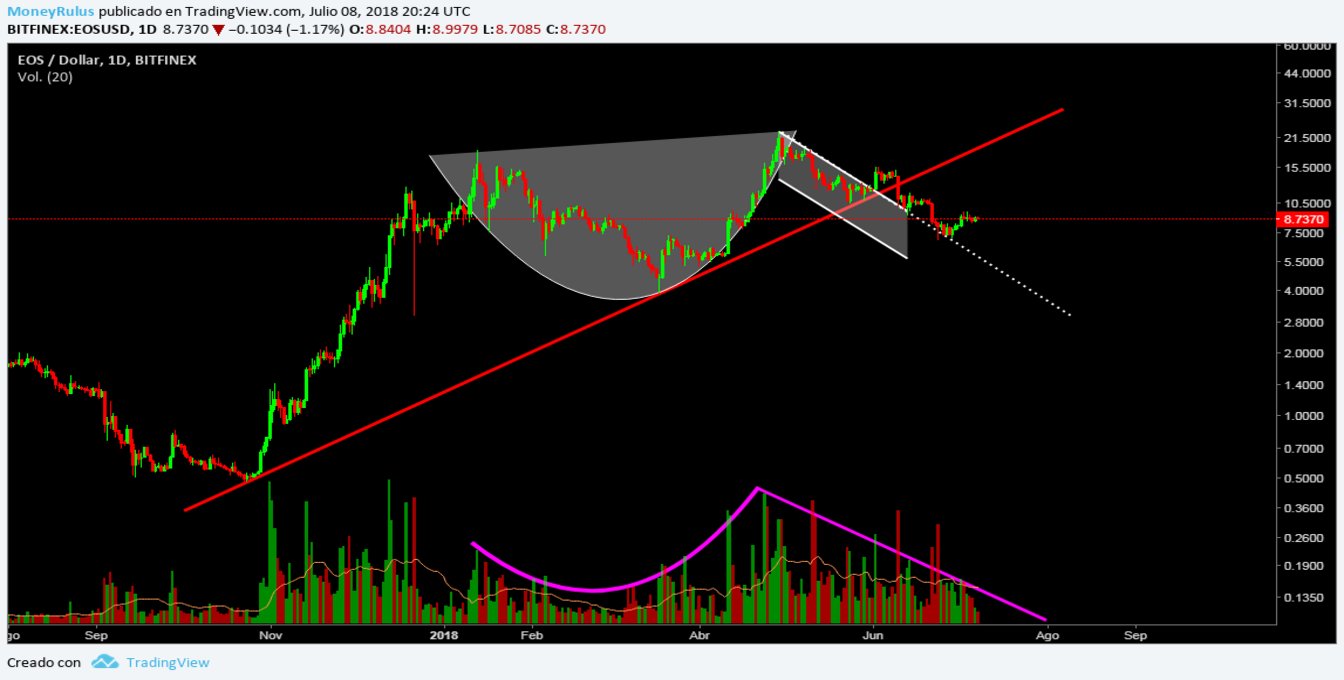
The pair EOS / USD in the BitFinex exchange house, shows a clear Cup & Handle pattern that seems complete, but is still pending to be validated, the volume supports it very well, so even if it has not made any relevant movement (upwards) so far, it’s still very interesting.
For some weeks, the price broke the rising trend line – red – long term, so now it became an important resistance for the currency. The price found support in the upper part of the ascending channel that creates the Handle, so that line of downward trend – white – short term, acquired more strength with that rebound.
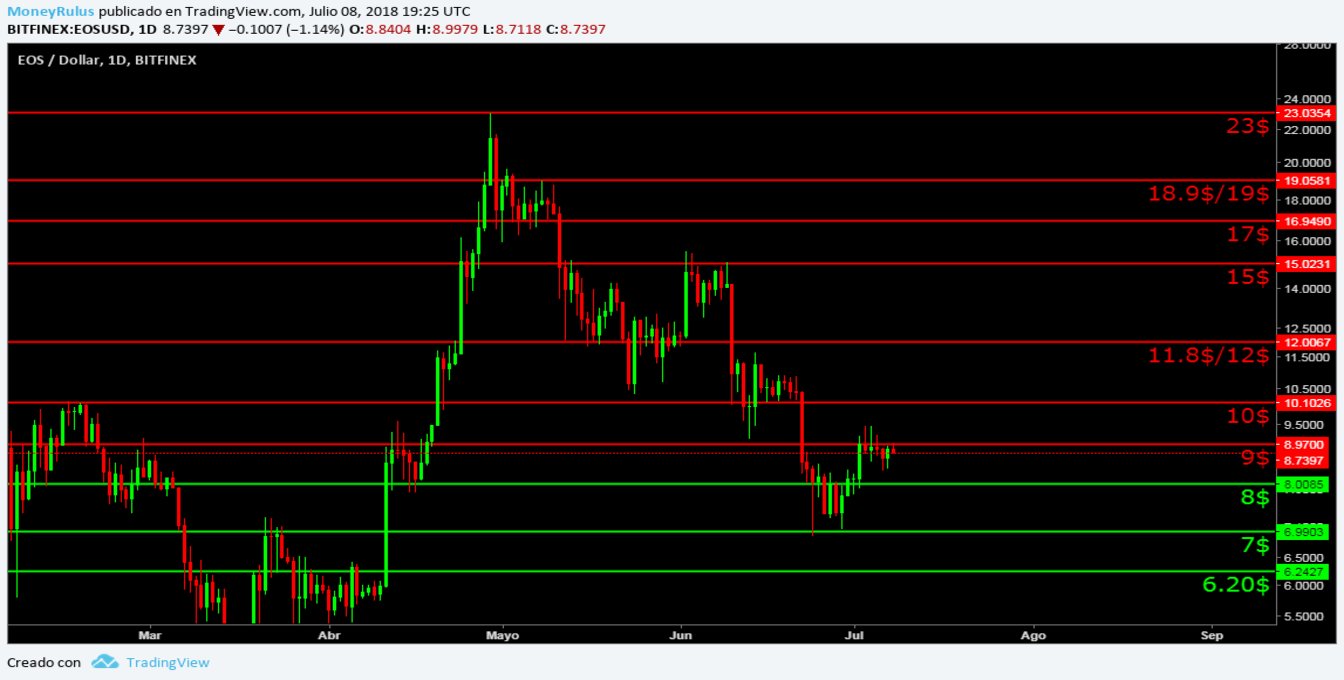
- Resistances can be glimpsed near $ 9, $ 11.8 / $ 12, $ 15, $ 18.9 / $ 19 and $ 23.
- As you can see supports in the areas of $ 8, $ 7 and $ 6.20.
Litecoin, LTC / USD
The LTC / USD pair in the Kraken exchange house, shows that there is a medium-term -green – downstream channel, which is being formed with the last relative minimums and maximums, which have existed since the beginning of the year, this channel indicates a clear direction to the downside that is very interesting, seeing the trend that the most important currencies like BTC or ETH bring.
In turn, the slightly bearish – orange – medium-term trend line, which served as a support, was broken and now becomes an important resistance. Likewise, the medium-term bearish – yellow – line remains valid as a resistance and shows completeness to the present.
The volume on the other hand is vague, although it supported the possible triangular pattern formed by the orange and yellow trend lines. The bears made their last advance, making a new minimum, which is undoubtedly of great importance, understanding the value that LTC has in the community in general.
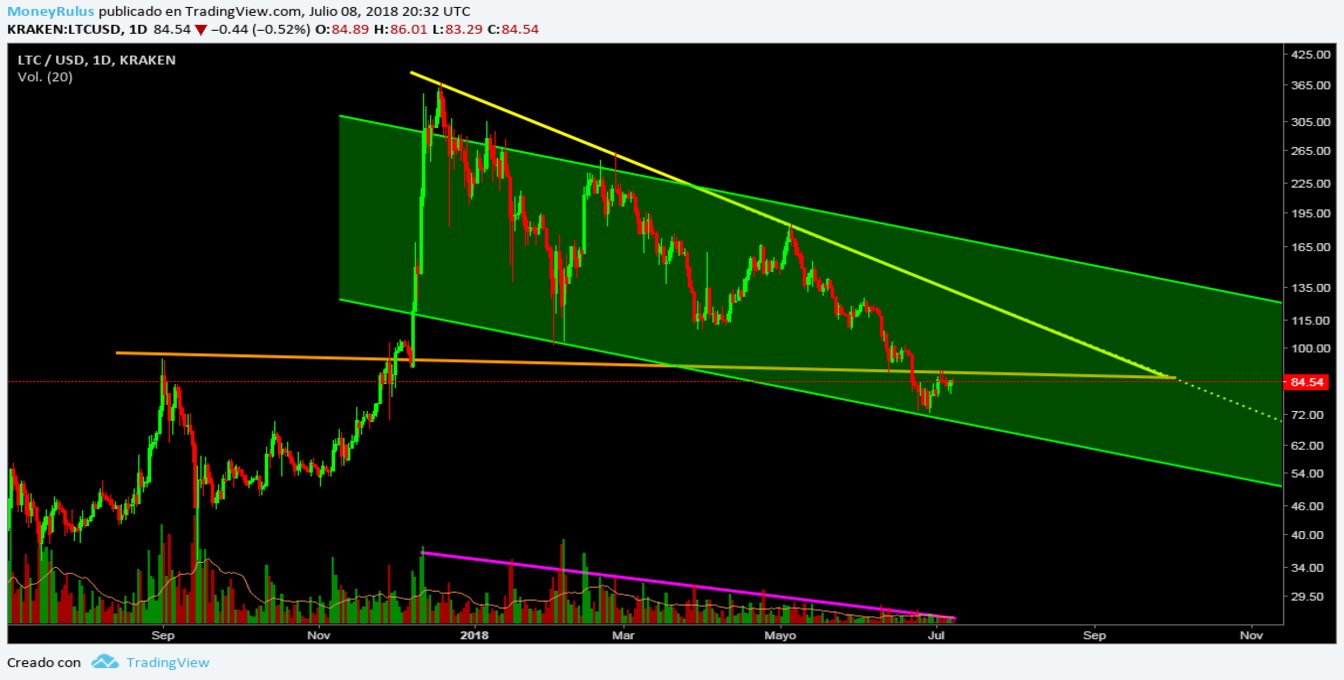
- The bears can generate resistance near $ 90, $ 100, $ 109, $ 120, $ 132, $ 152 / $ 155, $ 165 and $ 185.
- The bulls can establish supports at $ 80 / $ 85, $ 75 and $ 70.
Cardano, ADA / USDT
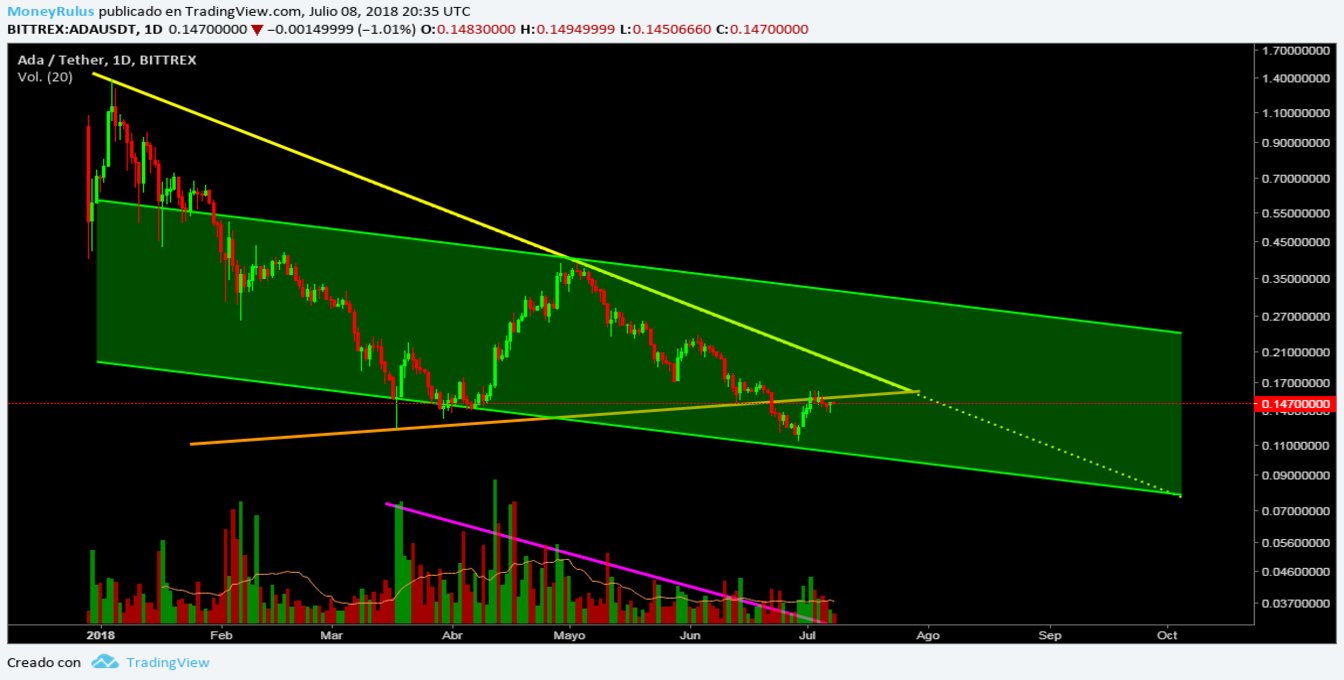
The pair ADA / USDT in the Bittrex exchange house, shows an interesting descending channel – green – medium term, which is formed with the latest minimums and maximums relative to the currency, as in others that we have already seen.
The upward trend line – orange – medium term, was broken and now becomes a resistance after it was a significant support, so it may be important to have it in sight when taking into account this currency.
In turn, the medium-term downward trend line – yellow – remains valid as a resistance. The price may be pulling back towards the orange trend line that we have already seen, so it is possible that it will break and it become a support again, or that it respects it as a resistance.
The volume is quite low, pointing to a clear lack of force in the movements, this may be a sign of caution. As with LTC and BTC, the bears managed to make new absolute minimums in their latest advance, so I think a rebound was necessary (however small), which is now taking place.
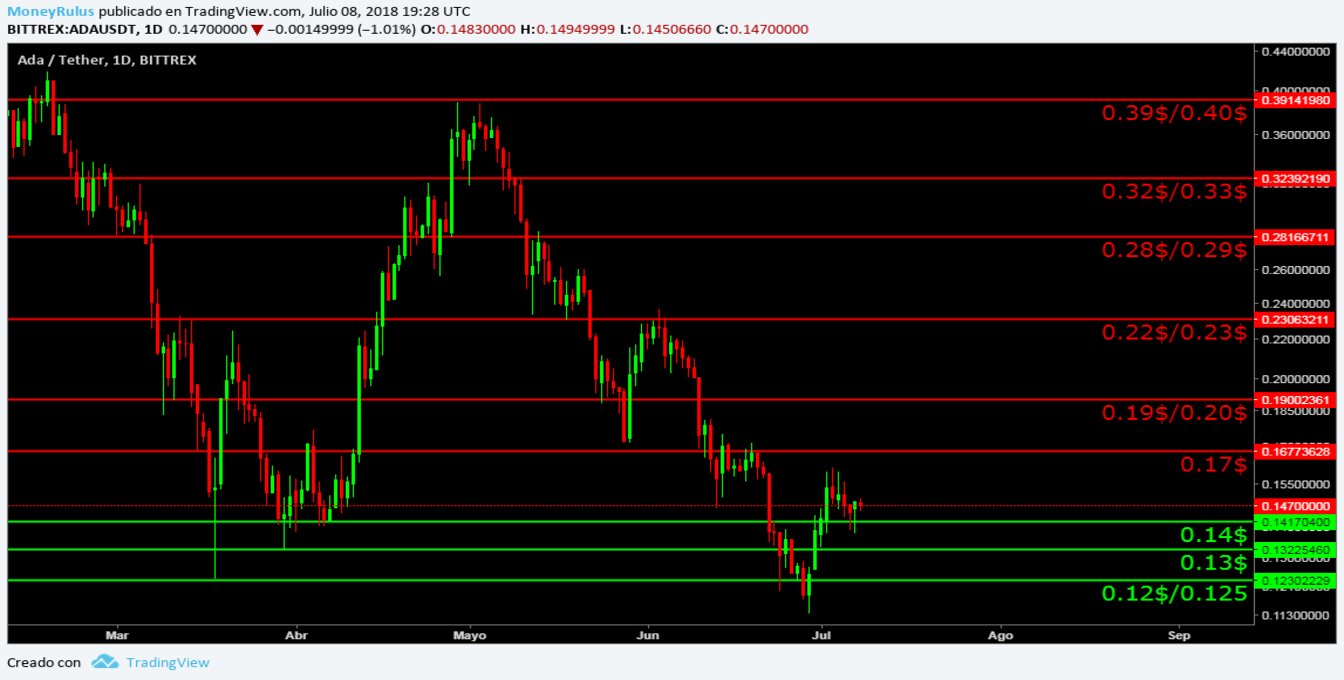
- Bears can find resistances in the area of 0.17 $, 0.19 $ / 0.20 $, 0.22 $ / 0.23 $, 0.28 $ / 0.29 $, 0.32 $ / 0.33 $ and 0.39 $ / 0.40 $.
- In turn, bulls can create supports close to 0.14 $, 0.13 $ and 0.12 $ / 0.125 $.
Stellar Lumens, XLM / USD
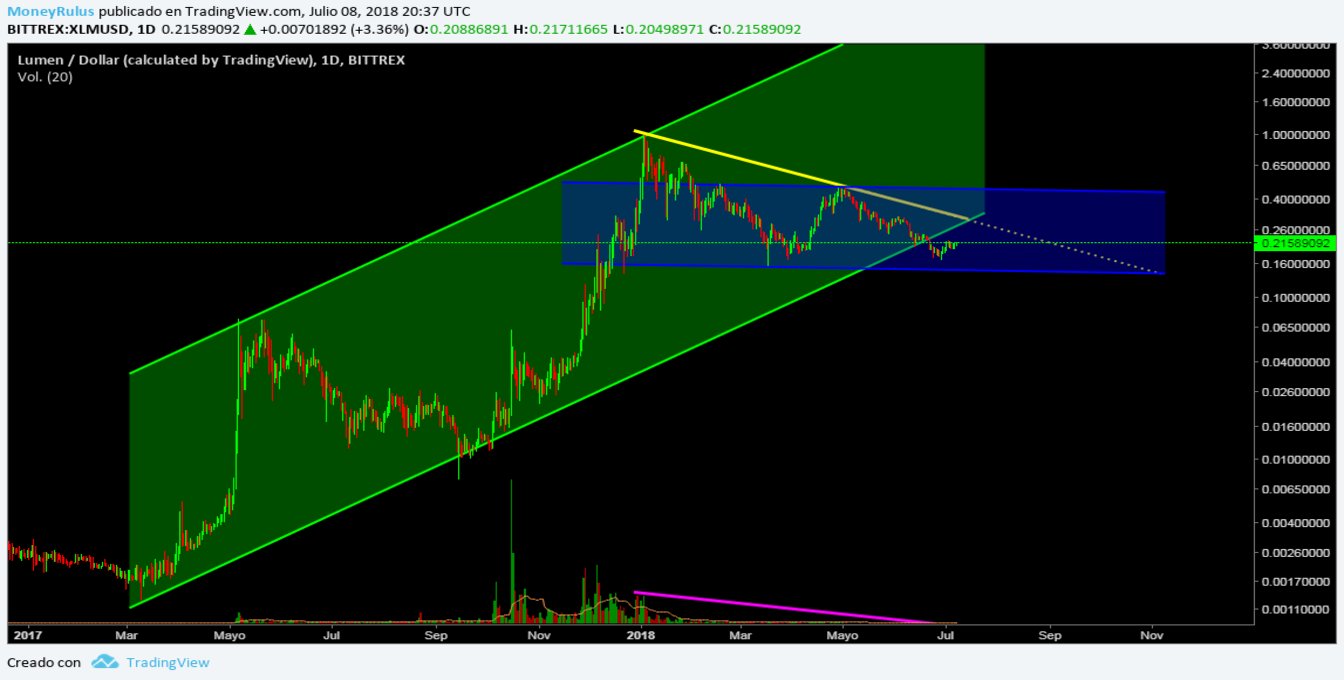
The pair XLM / USD in the house of changes Bittrex, shows a rising channel – green – of long term, which we already have in account.
At the same time it shows the descending trend line – yellow – of medium term, which is being respected as a value resistance, for which it is useful to keep it in mind.
The novelty is a slightly descending channel – blue – medium term, which is created by connecting part of the latest minimum and maximum that the currency has been making, this channel opens the door to the possibility that the price will continue lateralizing with the step of time, something that has been doing for some months.
The volume on the other hand, does not show greater strength, in fact is exemplified very weak and almost non-existent, this fact does not give good things to think and leaves much to be desired, so it would be good to be careful.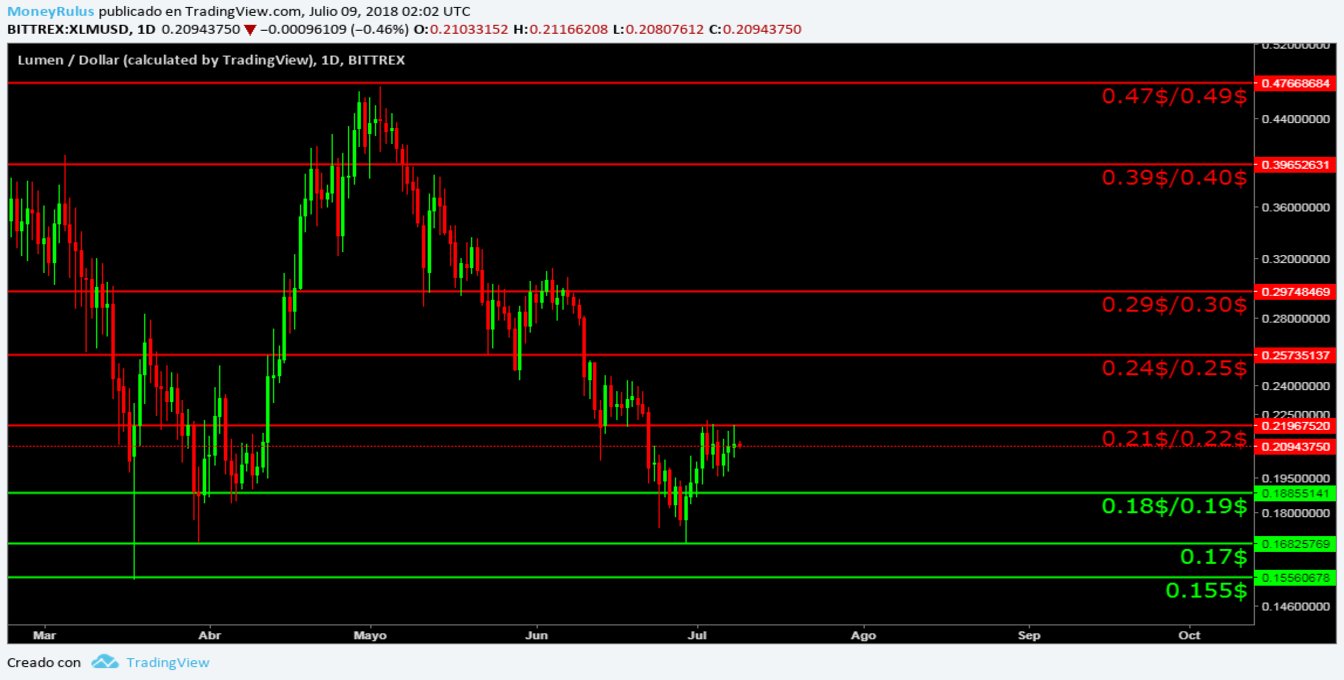
- The band of the bears can form resistance in the bands of 0.21 $ / 0.22 $, 0.24 $ / 0.25 $, 0.29 $ / 0.30 $, 0.39 $ / 0.40 $, 0.47 $ / 0.49 $ and 0.57 $ / 0.59 $.
- The side of the bulls, can do the same with the areas of 0.18 $ / 0.19 $, 0.17 $ and 0.15 $.
IOTA, IOTA / USD
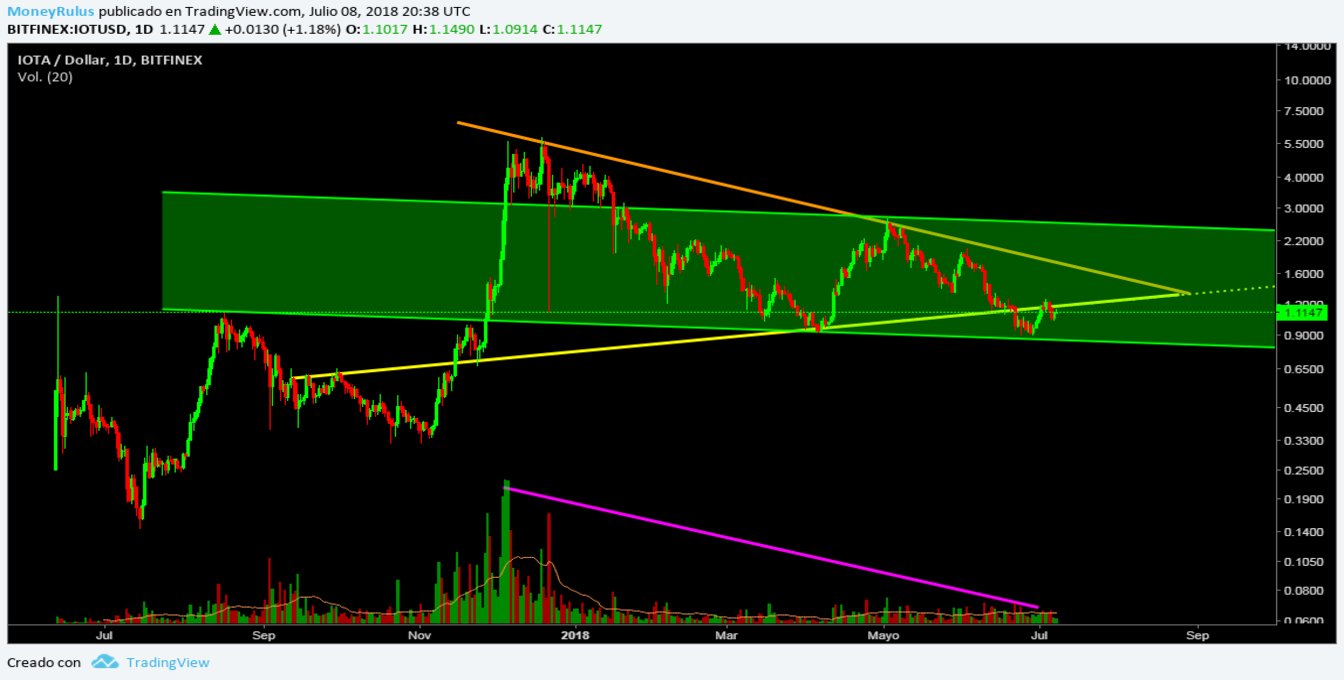
The penultimate pair is IOTA / USD in the BitFinex exchange house, the currency shows a downward channel – green – medium term, which shows an obviously bearish direction, this fact is interesting, because no currency escapes the influence Bitcoin establishes in the entire ecosystem, not even a third generation currency, as IOTA can be.
The upward trend line – yellow – in the medium term, was broken and now is established as a strong resistance, since before being violated it was a support.
On the other hand, the downward trend line – orange – in the medium term, is still standing resistance, something that apparently is repeated on several occasions in some currencies.
It is possible that the price is doing a pull back, so it is understandable that the volume is low, in the same order of ideas, the volume for some time has been declining in a considerable way, until reaching the current levels in which is very reduced, so the price action does not have special support from itself, at least for now.
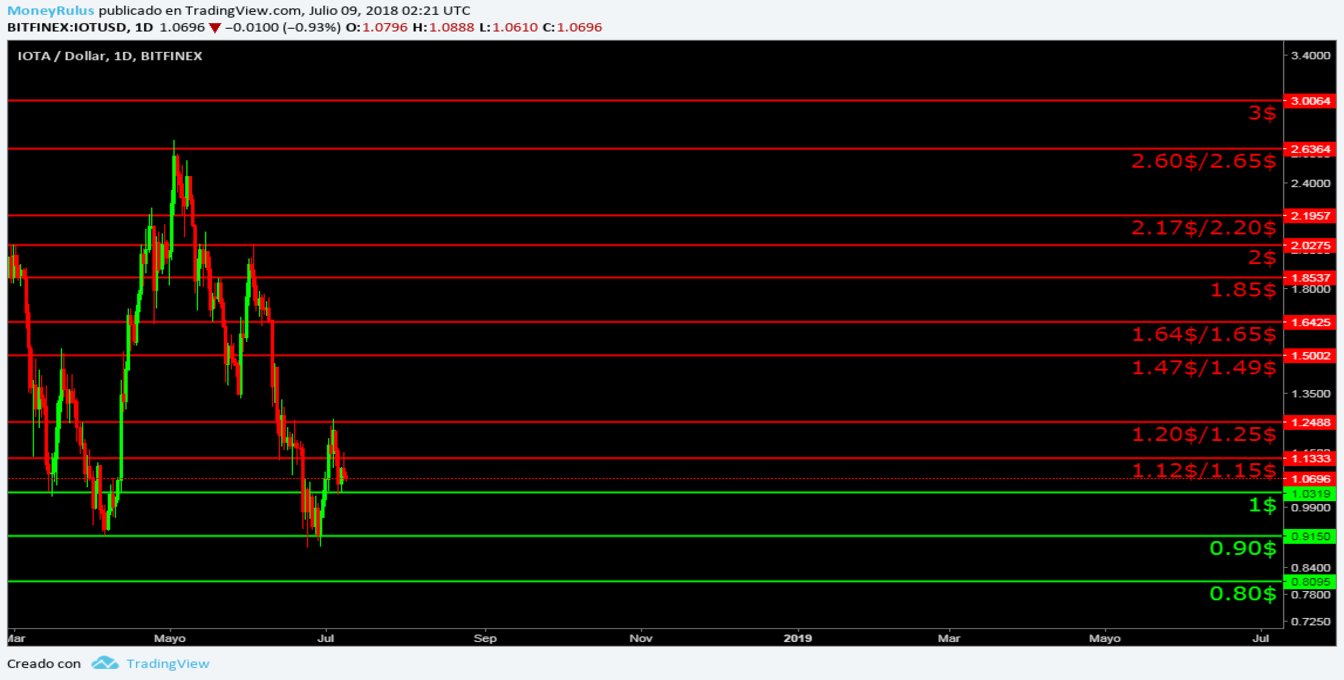
- Bears can form resistances in the areas of $ 1.12 / 1.15 $, $ 1.20 / $ 1.25, $ 1.47 / $ 1.49, $ 1.64 / $ 1.65, $ 1.85, $ 2, $ 2.17 / $ 2.20, $ 2.60 / $ 2.65. and $ 3.
- The bulls can constitute in supports the following zones: 1 $, 0.90 $ and 0.80 $.
NEO, NEO / USDT
A few weeks ago, the last coin of the top 10 according to CoinMarketCap was Tron (TRX), that went on to have a strong fight with IOTA (IOTA), in which IOTA (IOTA) so far is the clear winner; at this time Tron (TRX) is no longer in the top 10 and currently placed in 12th place.
Something interesting is that Tether is the currency in the 10th place, so we will take NEO (NEO) as the last currency to take into account in this review, even though it is in the 11th position, since it does not make sense to analyze Tether.
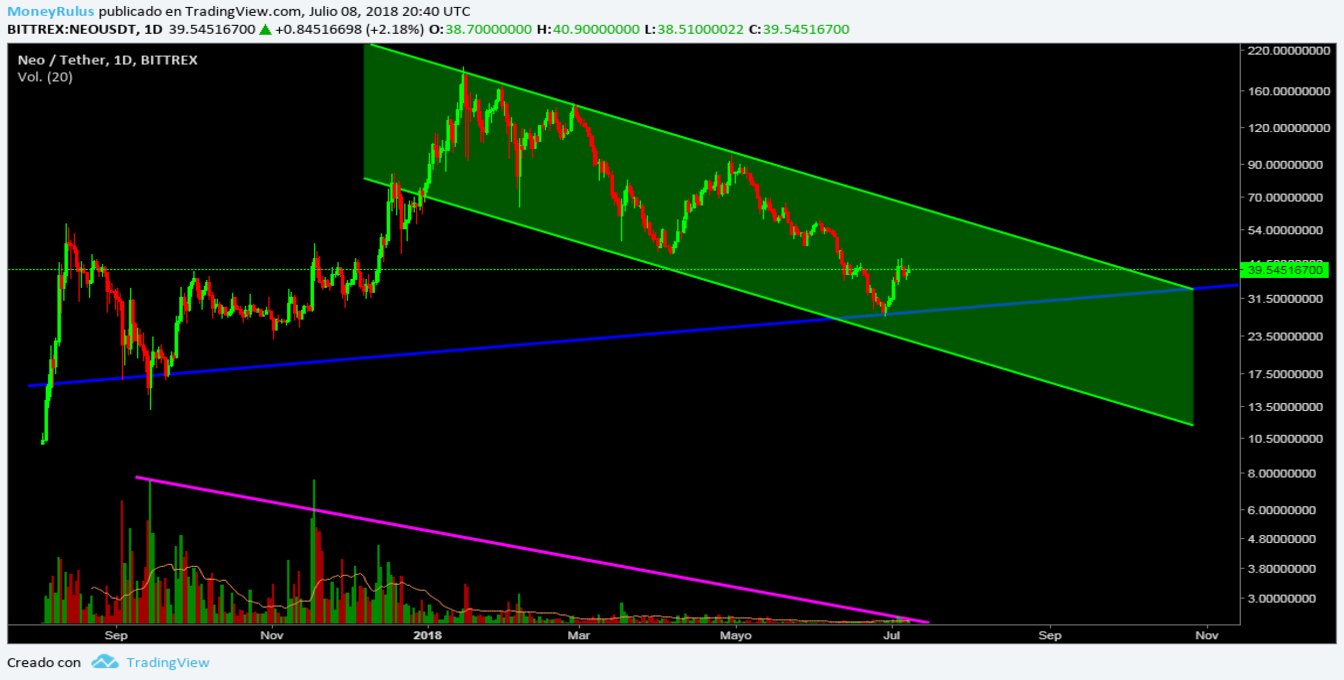
Finally, we see the NEO / USDT pair in the Bittrex exchange house, which shows a medium-term descending channel – green. The same channel, coincides with the medium-term downward trend line, which form the most important relative highs of the year, this fact is really interesting since it opens the possibility to the fact that the trend line strengthens the channel and vice versa.
For its part, the trend line – blue – medium term, remains an interesting support at this time, so it can be very useful to have it in mind for future situations.
The volume is low and weakened, so it is possible to conclude that there is little force in the movements of the price, even so it is useful to keep abreast, since things can change very fast, and it is better to be prepared for it.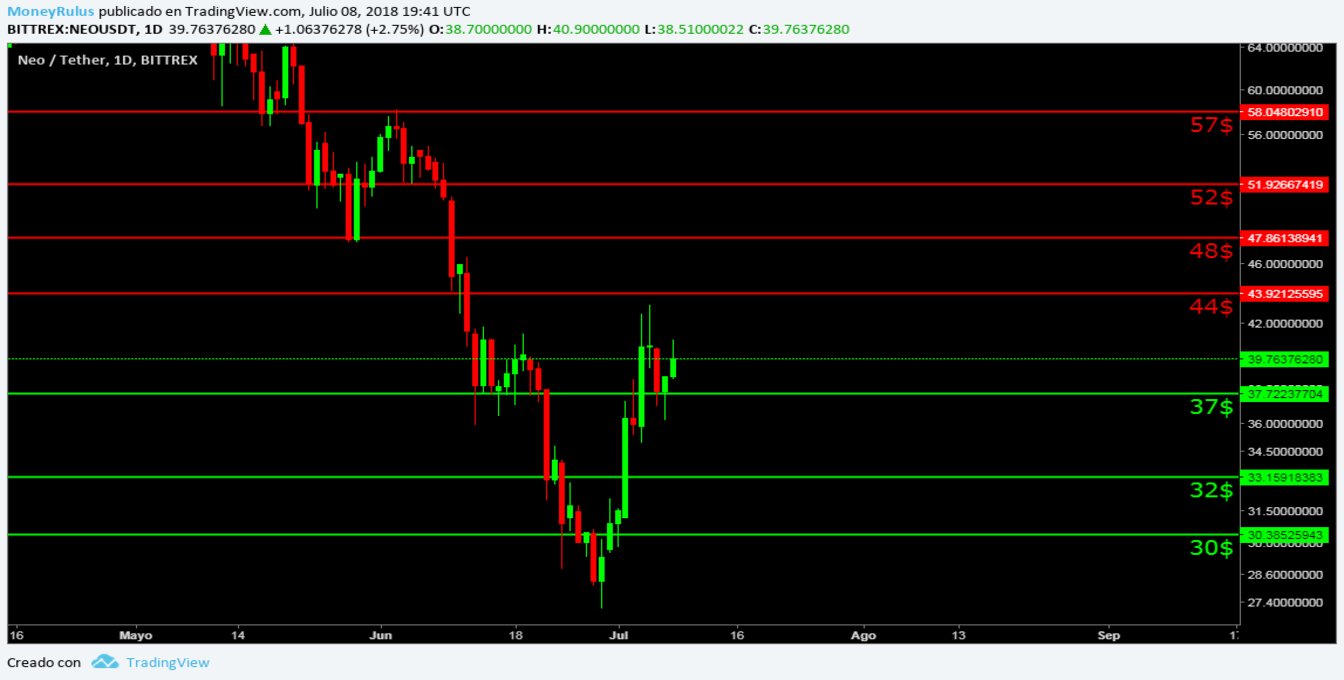
Bears can create resistance at $ 44, $ 48, $ 52 and $ 57.
And, concluding, the bulls can find supports close to $ 37, $ 32 and $ 30.