
During this week the market made things both disparate and interesting, in today’s technical price analysis we will tell you the most relevant data to know the current state of the market.
Some cryptocurrencies tended to raise their price for several successive days, showing a strength that is undoubtedly overwhelming. Others decided to take a more peaceful and quiet approach, where laterality was the main protagonist of many sessions and lastly some took an intermediate route between both perspectives already mentioned, therefore making interesting advances, but then proceeded to shrink in a curious way.
The general capitalization of the market since the last update was close to 285,000 million dollars, in these days that have elapsed, it has increased a little, approaching at this moment 297,000 million dollars.
During the day with the highest capitalization of the week, the market stood at 304,000 million dollars, a figure that has decreased slightly, since as we mentioned earlier, many cryptocurrencies have tended to be lateral, which causes prices to fluctuate both upwards and downwards, in narrow areas of contraction.
This is clearly reflected in the fact that the broad market has touched the 300,000 million dollars in capitalization during the past days by surpassing that figure a little and then falling again, unsure of whether it wants to go up or down. Uncertain about the future that will come.
Technical analysis – Bitcoin BTC / USD
This week, like the previous one, has been a roller coaster of emotions. At the time it seemed that the bulls were having many problems to overcome the barrier that the bears had imposed, close to $ 7,400, a strong battalion of bulls attacked with much force the same resistance that we are talking about now.
Soon, after a fight in which the bears failed to defend properly that area, the bulls took control over the area and turned it into a support of high strategic value for the future.
After beating the strong resistance in the $ 7,400, the next ceiling to break was the area of $ 7,700 , an area in which the bulls lost control momentarily. At one point it seemed thatthe advance of the bulls was just a matter of luck, so the bears decided to impose themselves strongly in the area; for a moment it seemed like another roof, but seeing that the bears were trusting and resting on their laurels, the bulls lashed out and cornered them into the next trench, around $ 8,500.
In this last area, the bulls were really exhausted and the bears took that advantage the and decided to lash out with all their forces that they had at that moment, to stop the seemingly unstoppable rise.
Since the bulls were tired and the bears took great pains to protect the area, it was finally established as a roof after the victory of the bears.
The bulls since the takeover by the bears, have failed to break that ceiling, seemingly stopping the unstoppable progress, or at least paused by the bears. But, samples like these are common in the markets, so it is not advisable to conclude things ahead of time.
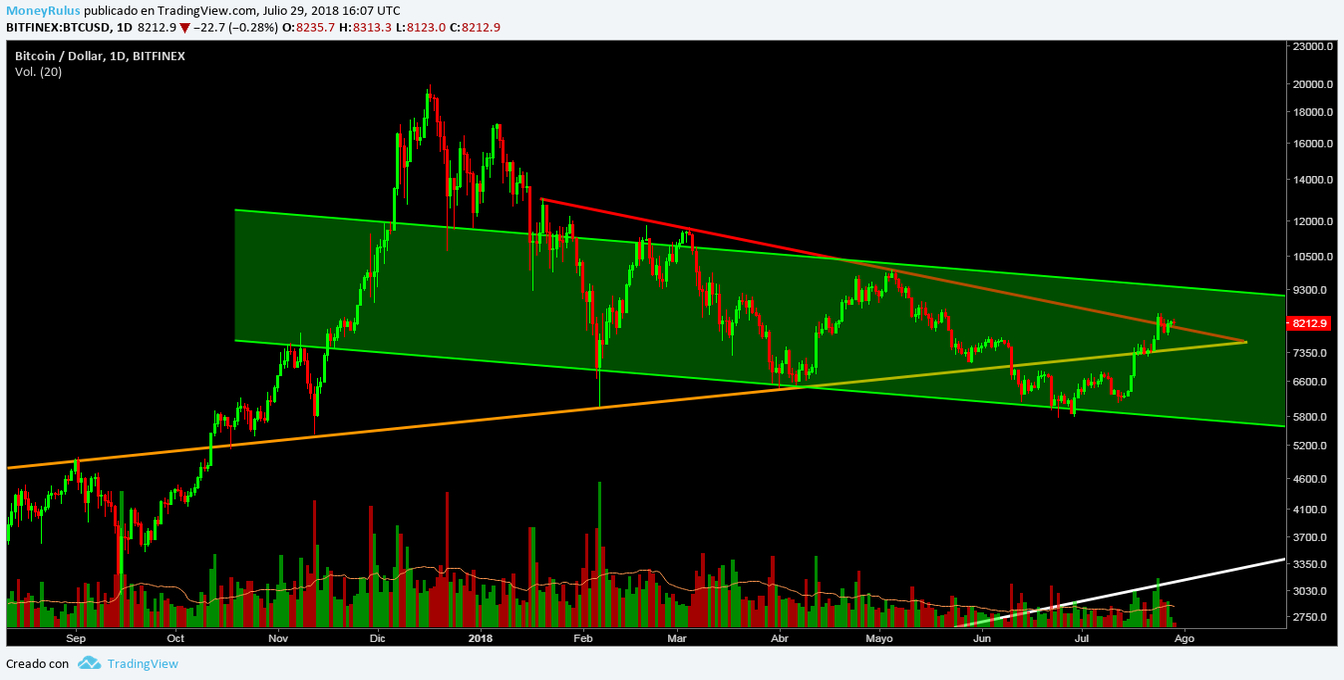
The BTC / USD pair in the BitFinex exchange house shows that the price is within the descending channel -green- medium term, after having bounced a couple of weeks ago in the lower part of it, it seems that it is now heading decisively towards the top, so that area can be established as a resistance to be taken into account.
Then, the medium-term rising – orange – trend line, remains valid and as a strong support, this area is also serving as a support for the price shocks in the higher resistance, so its importance has only increased.
The descending trend line – red – medium term, seems to be serving as a possible roof area, at this time gives the appearance of having been broken, but it is possible that it is a trap for bulls, or also called bull trap, so it is best to await the relevant confirmations in this regard, to see if it is a failed attempt or if its a real break.
The long-term upward trend line – white – remains valid, although distant; Looking at the flow of events, it seems unlikely that the price will go to that area, but it can always be valuable to take it into account, the fact that it is unlikely that the price goes to that area, does not make it impossible.
The volume showed strength during the week, although this was shrinking as time passed. It is always important to understand that there are advances and setbacks, so the fact that force has been one of the protagonists during the past days is not overshadowed by the fact that it has been decreasing little by little.
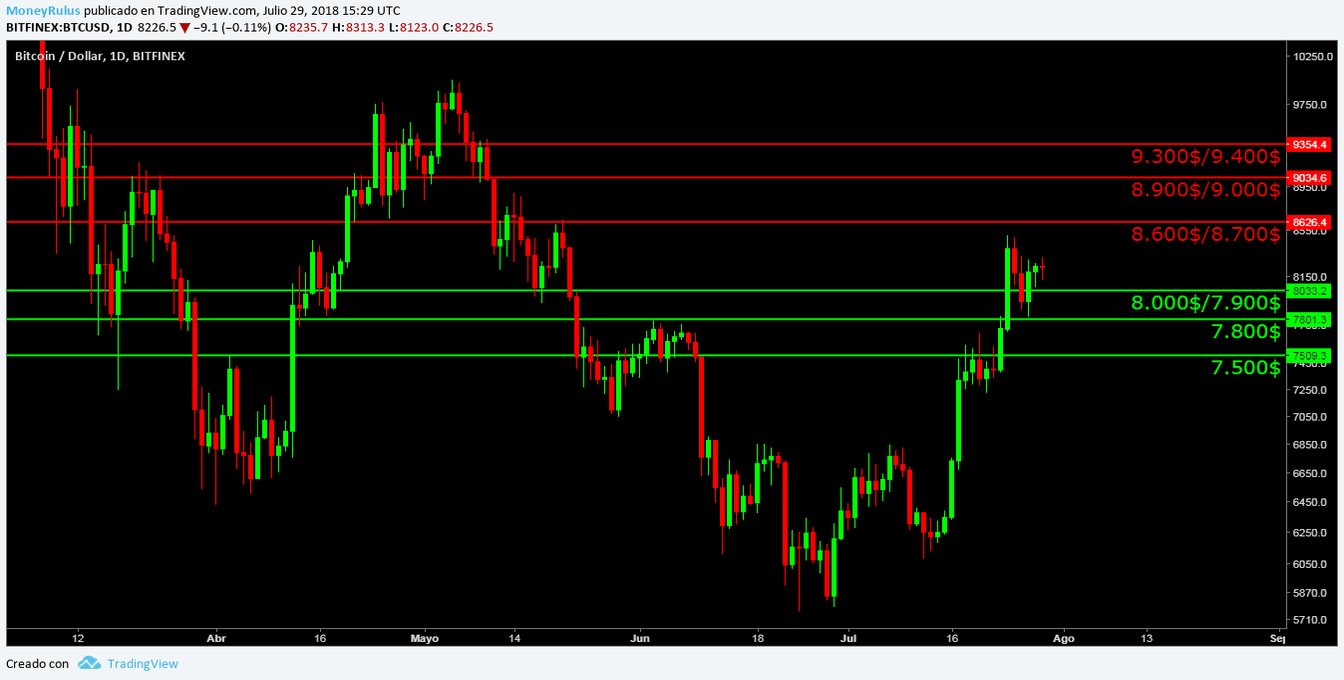
The bears can strengthen and reinforce resistances in the $ 8,600 / $ 8,700, $ 8,900 / $ 9,000 and $ 9,300 / $ 9,400 zones.
For their part, the bulls can use the new supports and use them in the areas of $ 8,000 / $ 7,900, $ 7,800 and $ 7,500.
Technical analysis – Ethereum ETH / USD
As we have seen for a couple of weeks, BTC seems to be doing something different from what many other alternative currencies are doing. We noticed this when ETH, which is the second most important currency in the market, did not have a similar behavior to BTC, this is something that is undoubtedly interesting, since for a long time it was practically an implicit norm.
This week, although the bulls have taken a bit of control of the situation, they have not done it at the level of how they are doing in BTC and they have not managed to stand firm in the same way, since both sides, both bulls and bears, have shown that they do not have absolute control in their hands, being that the last days instead of a battle in which one side advances on another without mercy, has been more a “take and give” in which both contenders attack but they also suffer the attacks of the other.
This may reflect a slow but necessary independence of the alternative currencies from BTC, something that many operators and analysts have been wanting for some time.
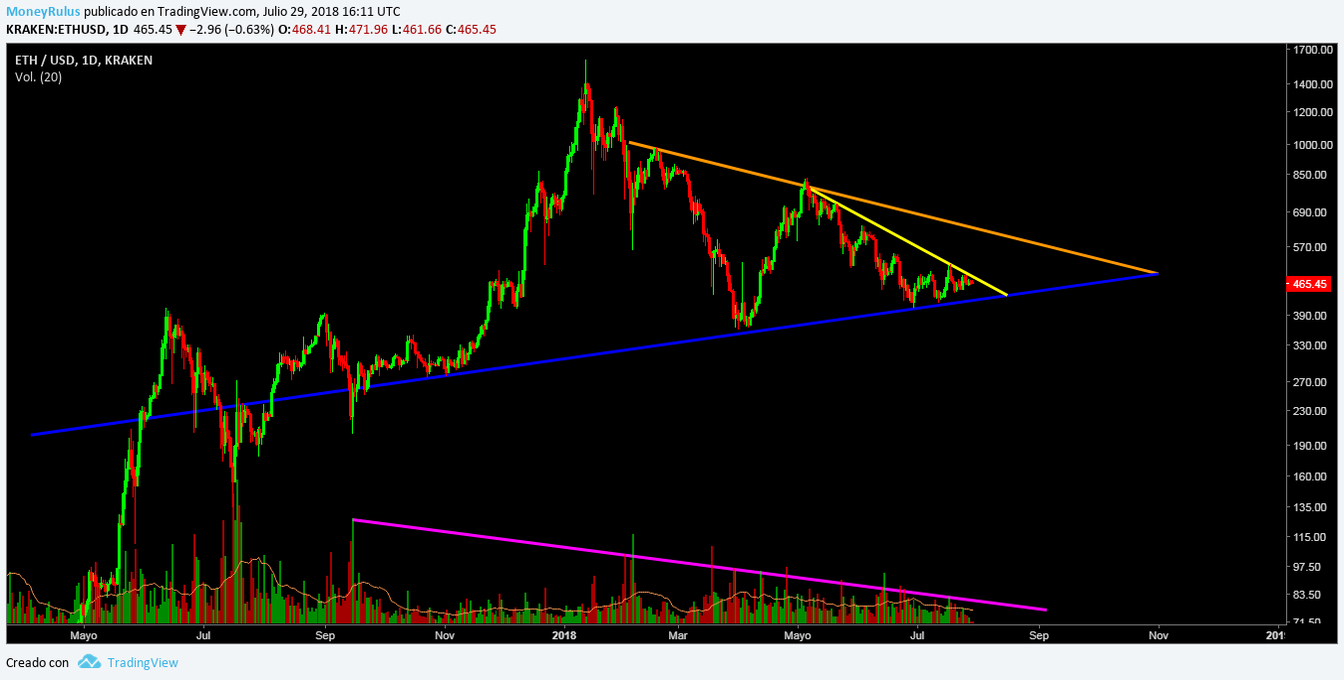
The pair ETH / USD in the Kraken exchange house allows us to observe that the price remains on the line of uptrend -blue- long-term, this is a support of remarkable importance, since it remains in force without being broken in any occasion, for a long time.
The medium-term bearish trend line – orange – remains in force, although the price has not approached it for weeks, it is important not to forget that at any moment the market can wake up and move strongly in some sense, so that having the possibilities studied never hurts.
If the price uses the blue trend line as a support, it could bounce back and head towards the orange trend line, to try to break it, since for now it remains a resistance.
At this time there is a short-term bearish – yellow- short term line, which is causing the price to not be able to rise, it has become a strong resistance that makes along with the blue trend line, that the price contracts and does not manage to ascend but neither descend.
This being so, if at any time this yellow trend line is broken, the next target may be the orange trend line, since it would be the next resistance that the price could try to beat, to stay on its upward path.
The volume increased the first days of last week, but since then it has been gradually decreasing, until being located in an area that was not seen for a long time. This is a sign of the strong contraction that the price is experiencing, so it would be good to wait to see how the strength develops in the future, as it is an aspect of vital importance.
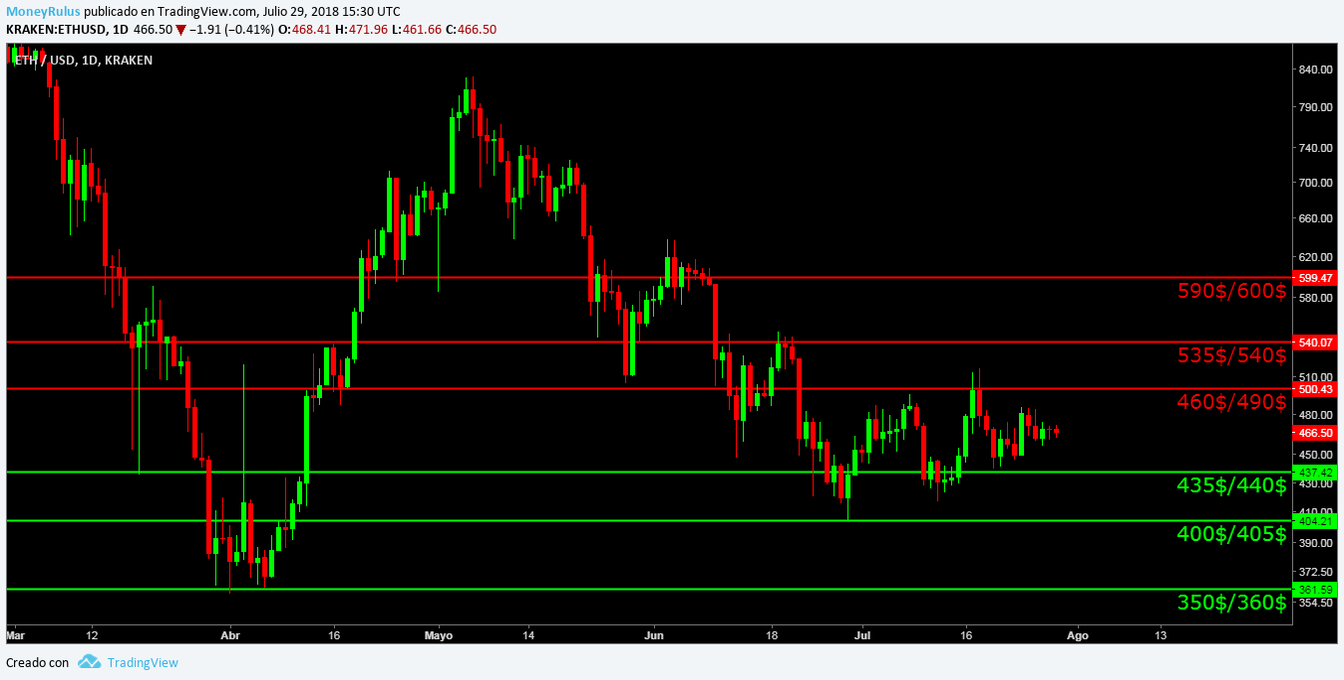 The bears could create resistances in the $ 460 / $ 490, $ 535 / $ 540 and $ 590 / $ 600.
And the bulls can reaffirm the supports in the areas of $ 435 / $ 440, $ 400 / $ 405 and $ 350 / $ 360.
Technical analysis – Ripple XRP / USD
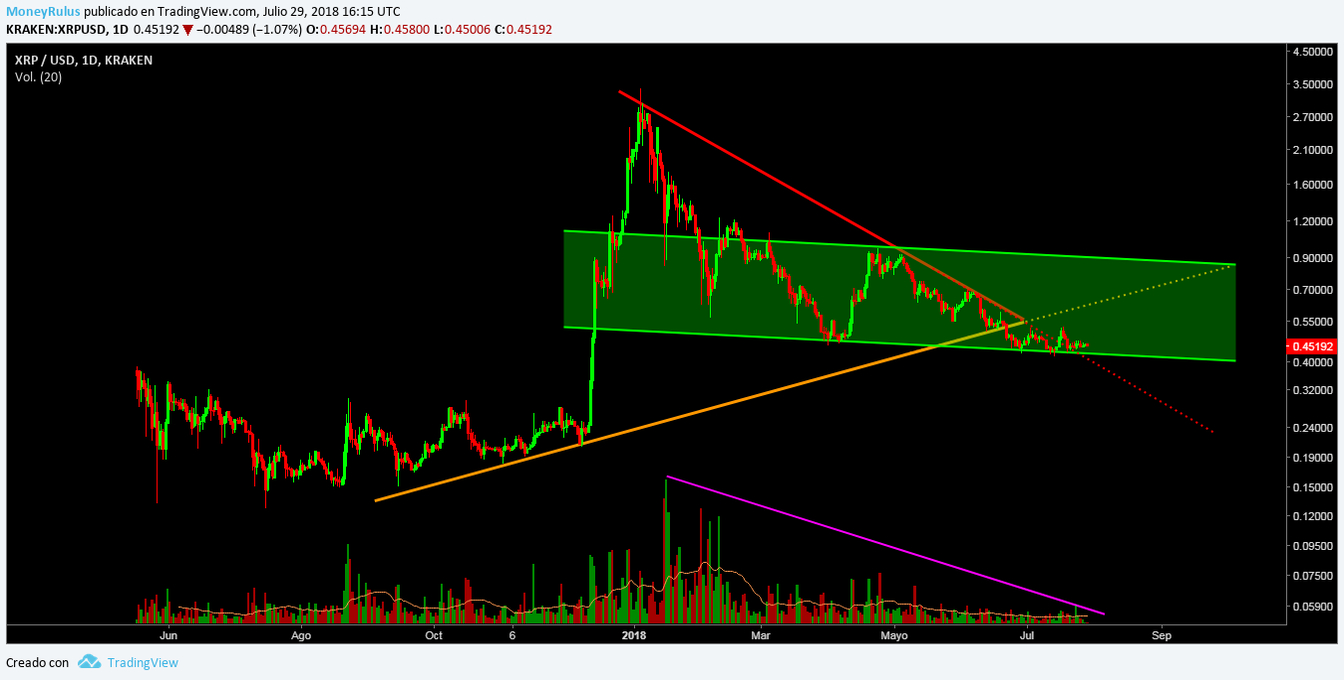
The pair XRP / USD in the Kraken exchange house allows us to show that the price is within the descending channel – green – medium term, precisely in the lower part of it, where it seems that it is trying to bounce. During the whole week the price it has remained extremely lateral and close to the aforementioned support, so we can believe that it is an area that provides ground to the price at this time.
Looking at the descending trend line – red – medium term, it seems that recently became an interesting support, after the beginning of the week, the price found ground in that area, where the red trend line converged with the lower part of the descending channel, an area that showed its worth, by supporting the fall in price, in a stable manner.
The line of upward trend -orange- medium term, at this moment serves as a resistance, for some time now the price has not been able to get close to it, but still we must not forget it, since it seems less than 2 weeks ago that it tried to approach it only that, as we know, it did not succeed.
Regarding the volume, something similar happened to what happened in ETH, at the beginning of the week the strength increased, but then it fell as time passed. Right now, it is very low, so it would be best to wait.
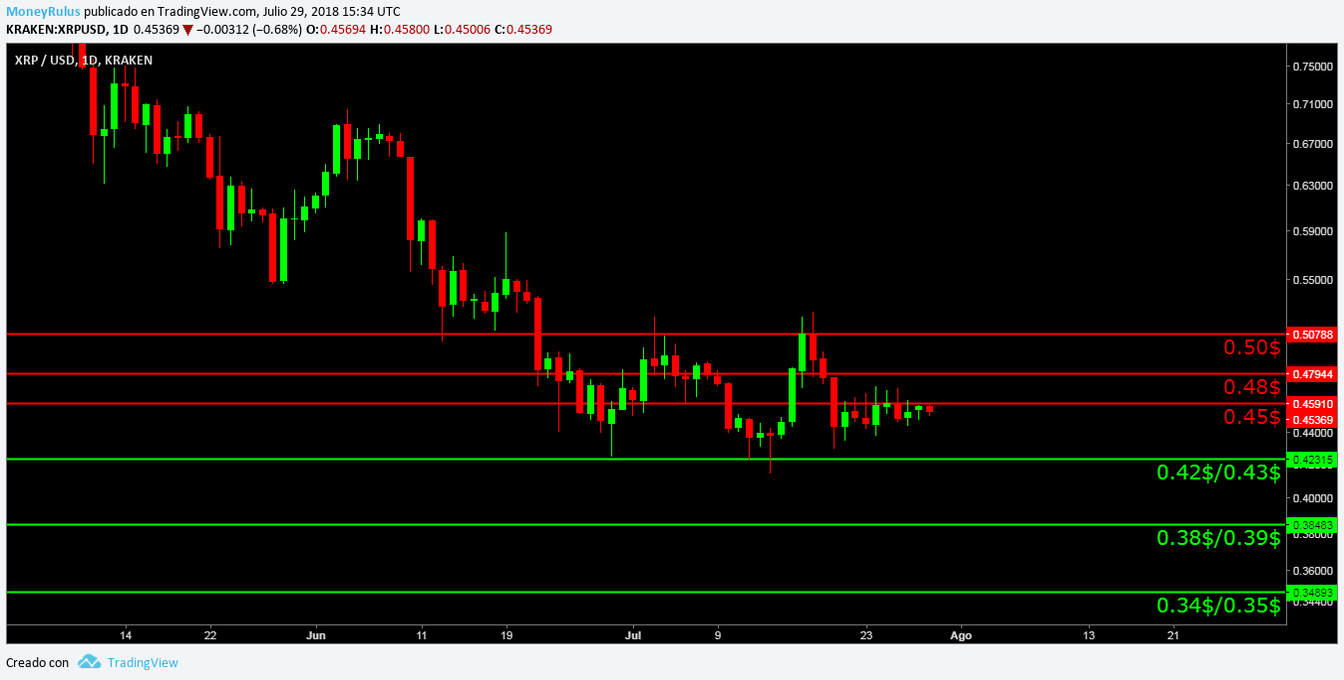
The bears can form possible ceilings in the areas of 0.45 $, 0.48 $ and 0.50 $.
The bulls can strengthen the supports that are in the 0.42 $ / 0.43 $, 0.38 $ / 0.39 $ and 0.34 $ / 0.35 $ areas.
Technical analysis – Bitcoin Cash BCH / USD
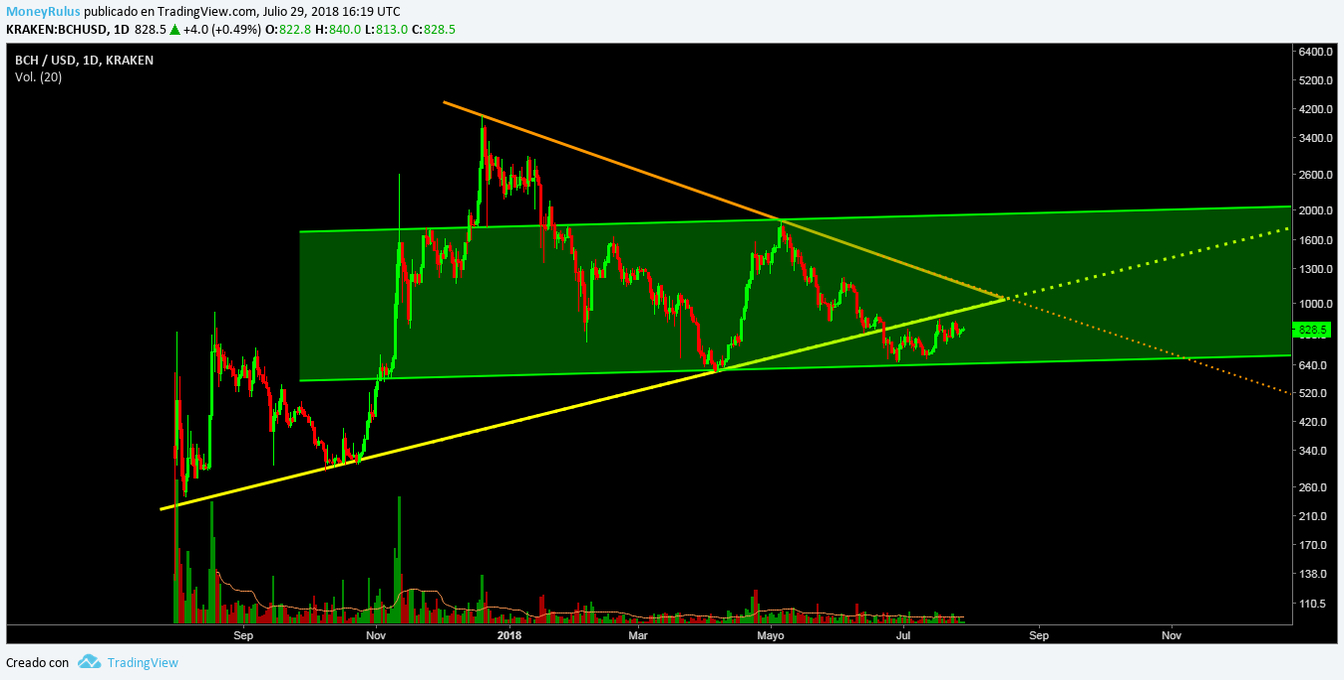
Looking at the BCH / USD pair at the Kraken exchange, we see that the price is in the middle part of the slightly bullish channel – green – medium term, specifically near the bottom of the channel, an area that has served as support for some time.
At this time it seems to be approaching the long-term bullish – yellow – line, which after having been broken as a support, has become an important resistance.
After bouncing in the lower part of the green channel, the price apparently decided to move towards the yellow trend line, this is the first obstacle in case it goes to the upper part of the channel, which is another very strong resistance.
The medium-term bearish – orange – trend line is still in force, but the price has not visited it for a few months, which is why, due to its imminent proximity and importance, it can also be a strong resistance that creates a difficult wall to cross for the bulls, in case they take control of the market and intend to make the prices go up.
It is possible that the price should face the area in which the yellow and orange trend line converge, this area would be an even more important resistance due to the union of both trend lines, so in the case that it takes too long to break the yellow trend line, the road would be even more complex in the near future.
Between both trend lines (yellow and orange) and the channel, the price is gradually contracting, so that each time it seems smaller and stuck between the support and resistance, let’s wait to see which one breaks and which one it respects.
The volume during the first days was strong, but at this moment it is as low, as it was some days 4 weeks ago, the ideal would be to see a considerable increase that shows strength on the part of some side, whether it is the bulls or bears, since regardless of the sense in which it is applied, force is a good indication whenever it appears.
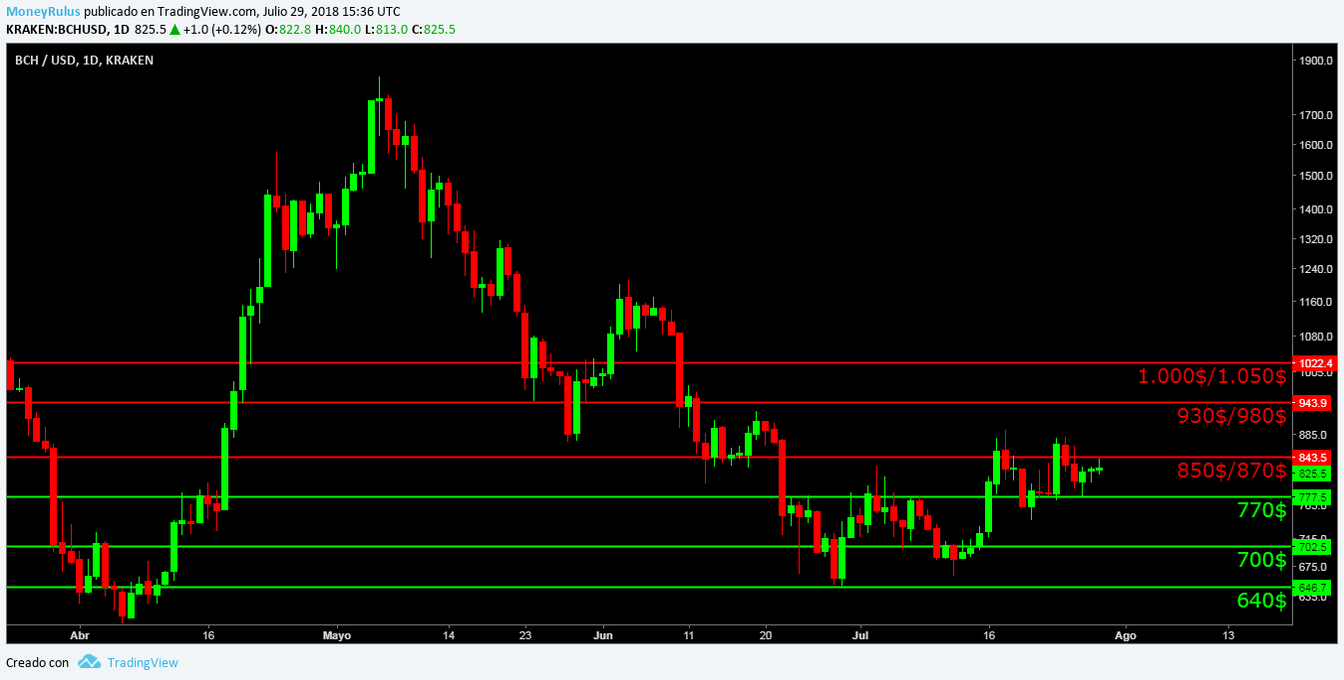
The bears can increase the pressure and create resistance in the $ 850 / $ 870, $ 930 / $ 980 and $ 1,000 / $ 1,050 areas.
The bulls can do the same and strengthen the supports around the areas of $ 770, $ 700 and $ 640.
Technical analysis – EOS EOS / USD
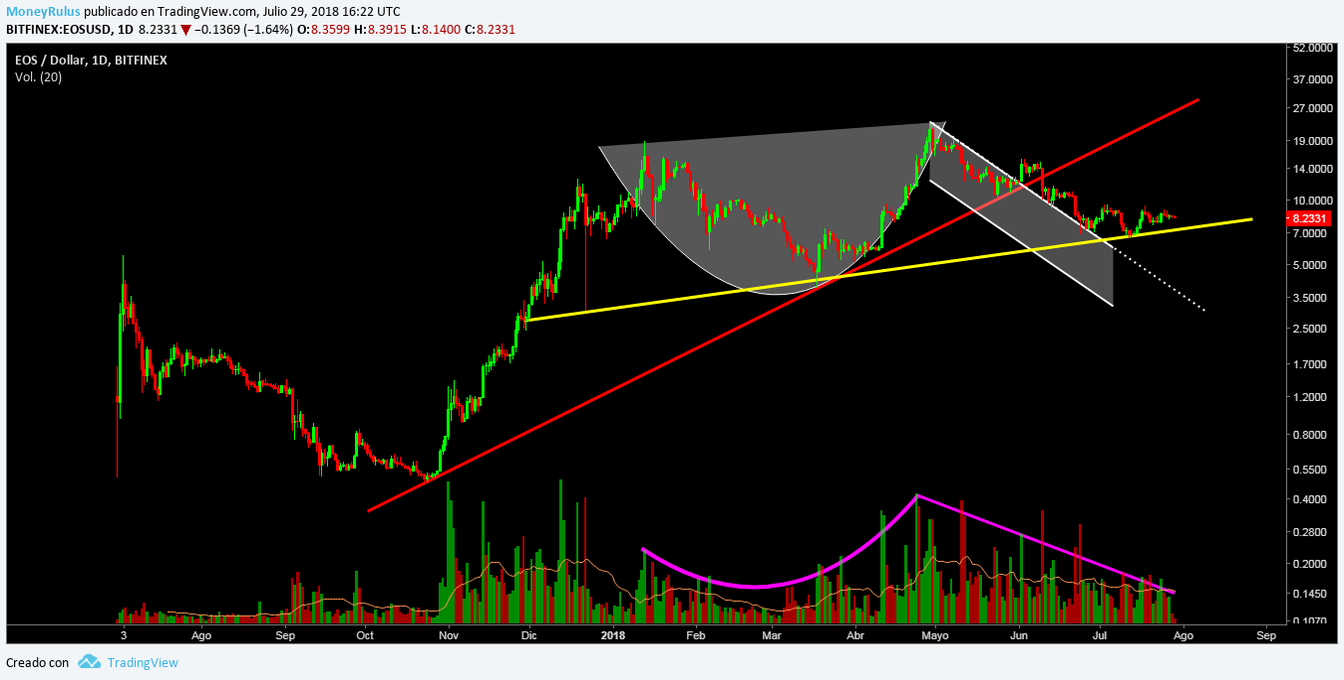
The EOS / USD pair in the BitFinex exchange house shows that the Cup & Handle pattern that we have been following for several weeks is still valid. The price has not dropped below the minimum of the Cup pattern, so until now everything is developing well, according to the rules of technical analysis.
At this time the price is very close to the line of upward trend -yellow- medium term, which served as a support less than 2 weeks ago, this area as of now has been established as an important support for the currency.
The long-term – red – bullish trend line is valid, but the price has not approached it for a few months, since it broke with force when it was a support, after having made the trap for bulls, in which it seemed that the Handle pattern was being broken upwards in a good way.
Subsequently, the trend line became a resistance, so it will be a hard roof to beat, as it is undoubtedly a zone of great importance, for a long time.
The price so far failed to re-enter the Handle (although it did try to bounce several times at the top of the channel) as the bulls had enough strength to prevent the bears to achieve their purpose.
The volume of this currency is one of the most interesting and strong in general, for months has been moderately high, and last week it remained in a viable area where it was not high, but not invisible, but during the last days it tended to be more invisible as it decreased, so at this time is really low, although knowing the strength that is usually in the pair, is a sign of attention but not an alarm as it is in other currencies.
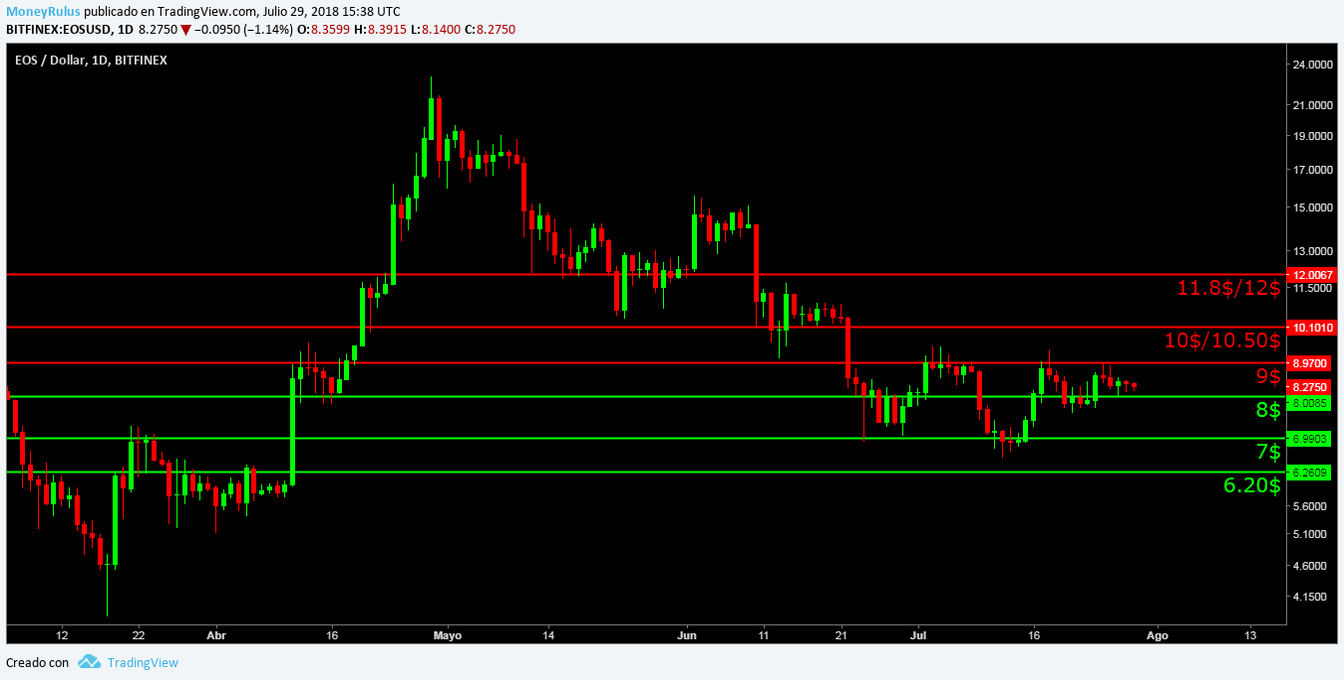
Bears can establish trenches at $ 9, $ 10 / $ 10.50 and $ 11.8 / $ 12. Creating resistances in those areas.
The bulls can reinforce the supports that they established in the $ 8, $ 7 and $ 6.20.
Technical analysis – Litecoin LTC / USD
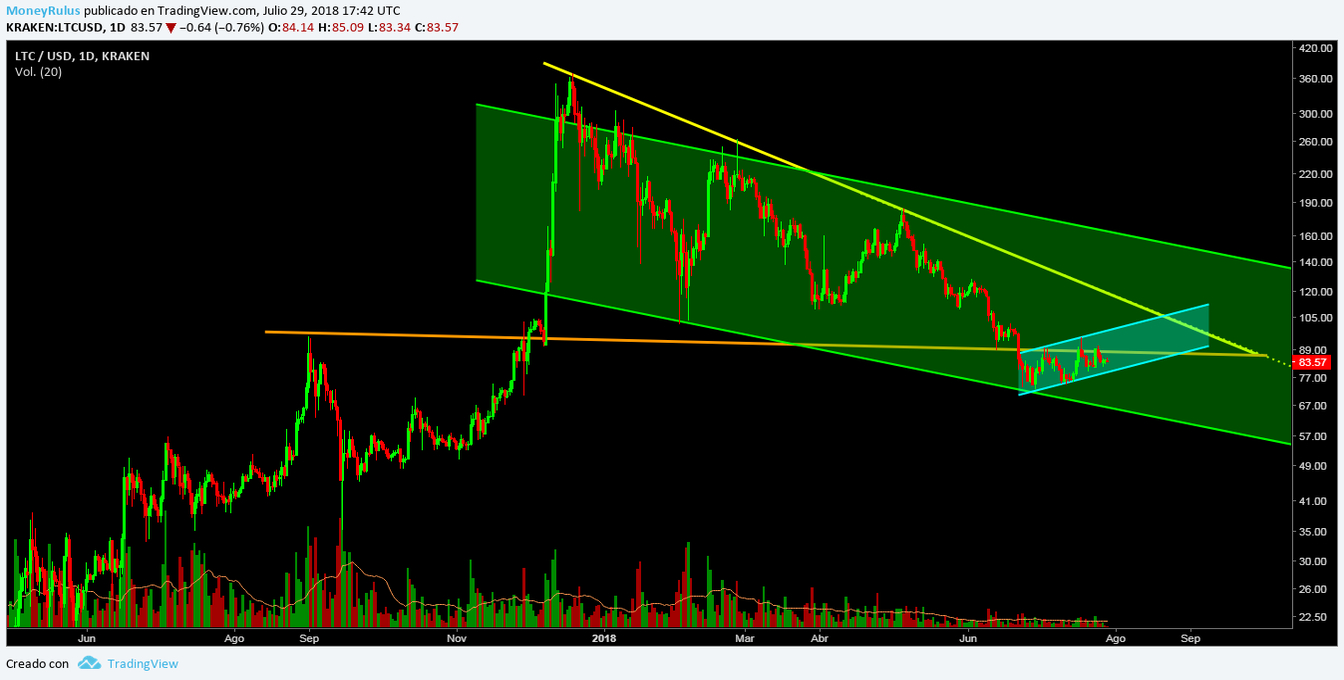 The LTC / USD pair at the Kraken exchange house shows really interesting things, the price is within a medium-term – green – descending channel, exactly near the bottom of it, after having bounced in that area, which is an important support; it is possible that the price is directed towards the upper part of the channel, which can be a great resistance.
The medium-term lateral line – orange – is acting as a strong resistance that is stopping the price in its onslaught to reach the top of the green channel, this is the first of some resistances that must be broken to achieve that objective.
If it succeeds (breaking the orange trend line) the next resistance will be very clear; the medium-term downward trend – yellow – line is an area in which the price could find a ceiling (at least temporary) on its way to the top of the green channel, so that by now two clear trenches of bears are outlined on the road, everything will depend on the strength of the bulls to achieve their goal.
For almost a month, the price has been creating a short-term ascending channel – turquoise – which has helped in the rise of the currency since a few days ago; This channel can be a potential way for the price to break both the yellow and orange trend line, and thus achieve the objective of trying to beat the upper part of the green channel.
The volume during the past weeks has tended to be similar, in a zone of stability in which it does not increase, but neither decreases, these last days this has changed a little and has begun to decrease, remaining very low, although it is also important to note that some days of the week it increased temporarily, showing greater strength than what it now presents. In any case, stability is a good sign, not as positive as constant growth, but much better than permanent decrease.
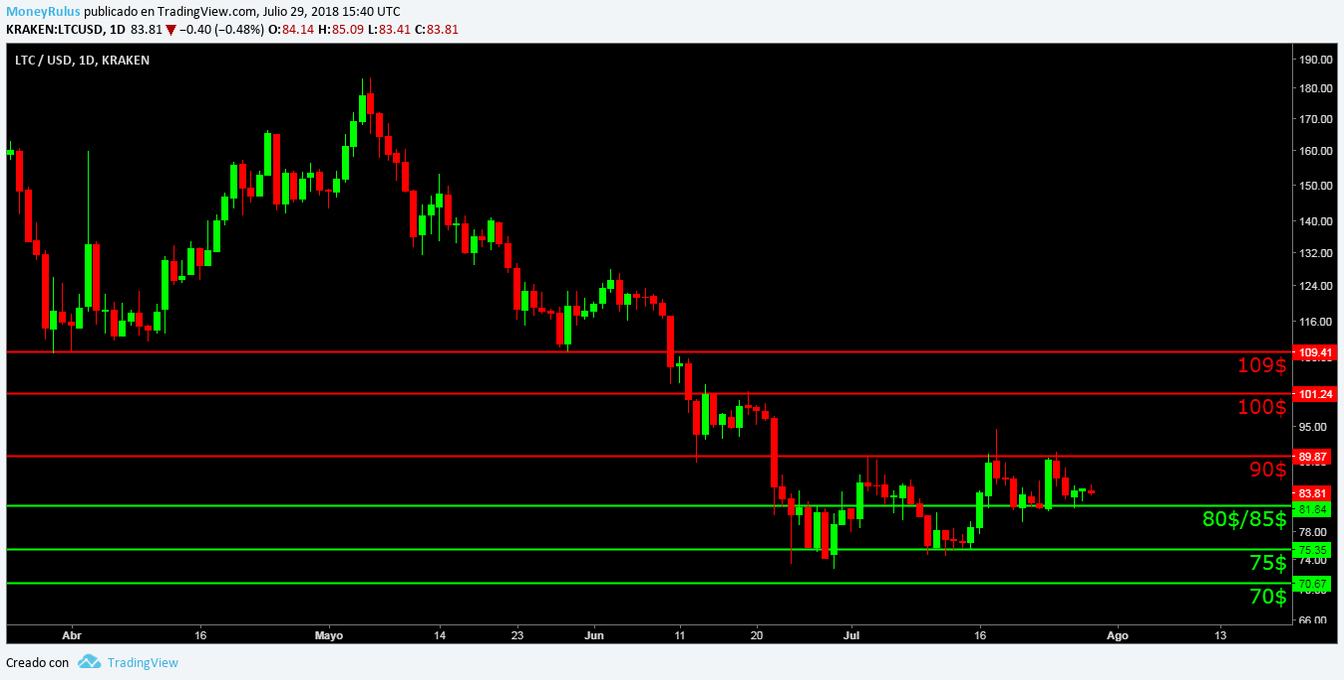
The bears could form resistances in $ 90, $ 100 and $ 109.
And the bulls would consequently create supports in the areas of $ 80 / $ 85, $ 75 and $ 70.
Technical analysis – Cardano ADA / USDT
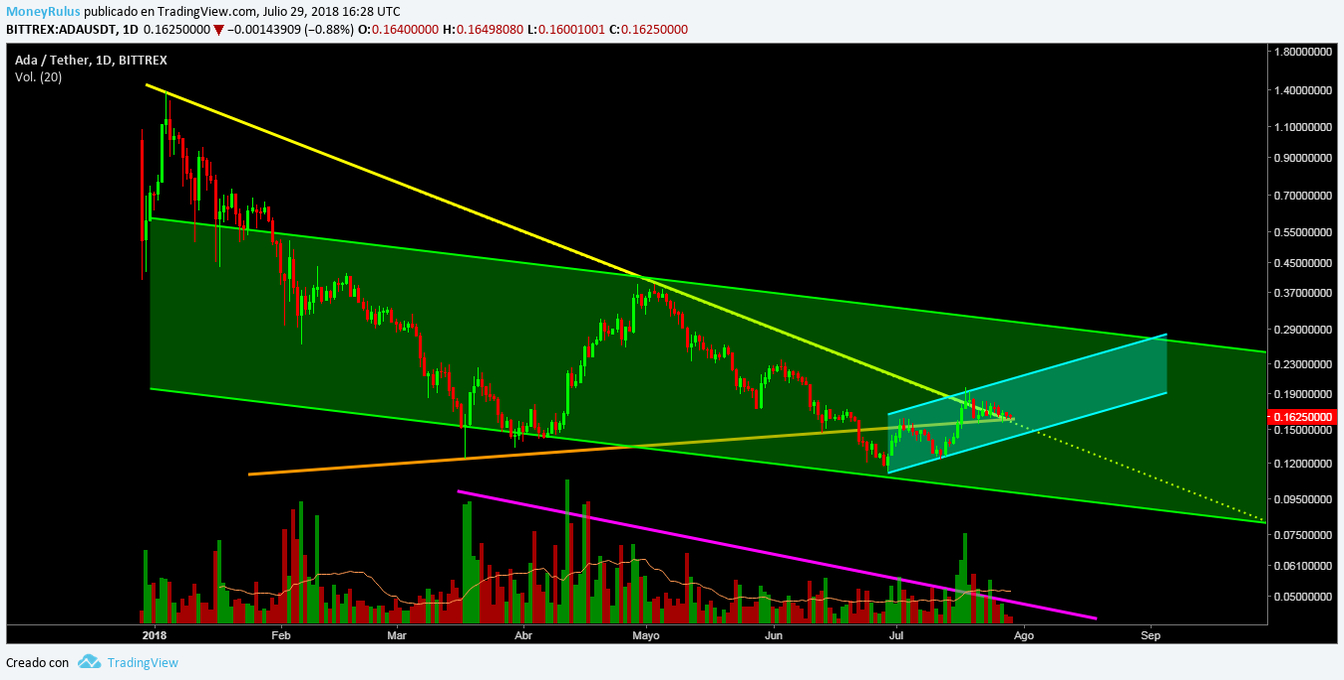
The ADA / USDT pair at the Bittrex exchange house is at a stellar moment; the price is in the middle part of the long-term green-descending channel and now seems to go towards the upper part of the channel, after having found support in the lower part.
The medium-term rising trend line – orange – was broken as resistance and became a support, so now it is an area where the price found ground and could do it again if necessary, in addition to that, it is trying to beat the resistance of the descending trend line – yellow – medium term, which for more than a week keeps the price contracted, along with the orange trend line.
Apparently it just broke the yellow trend line timidly, but does not show strength at all, so the currency is even more contracted than last week.
It is possible that all this break is a trap for bulls like the one that happened in EOS, so the wisest thing is to be careful. In case it manages to overcome this resistance, the next objective would be the upper part of the channel, which is an area that the bulls want to try to turn into a support, even though at this moment it is a trench for the bears.
Since it bounced in the lower part of the green channel, it began to form a short-term ascending channel – turquoise – which, like in LTC, can provide a way for the price to reach the upper part of the green channel.
The volume has not stopped decreasing since last week, so we can infer that there is some indecision and lack of strength. In these cases, suspicion can be very useful, since it is better to wait for confirmations than to risk in vain.
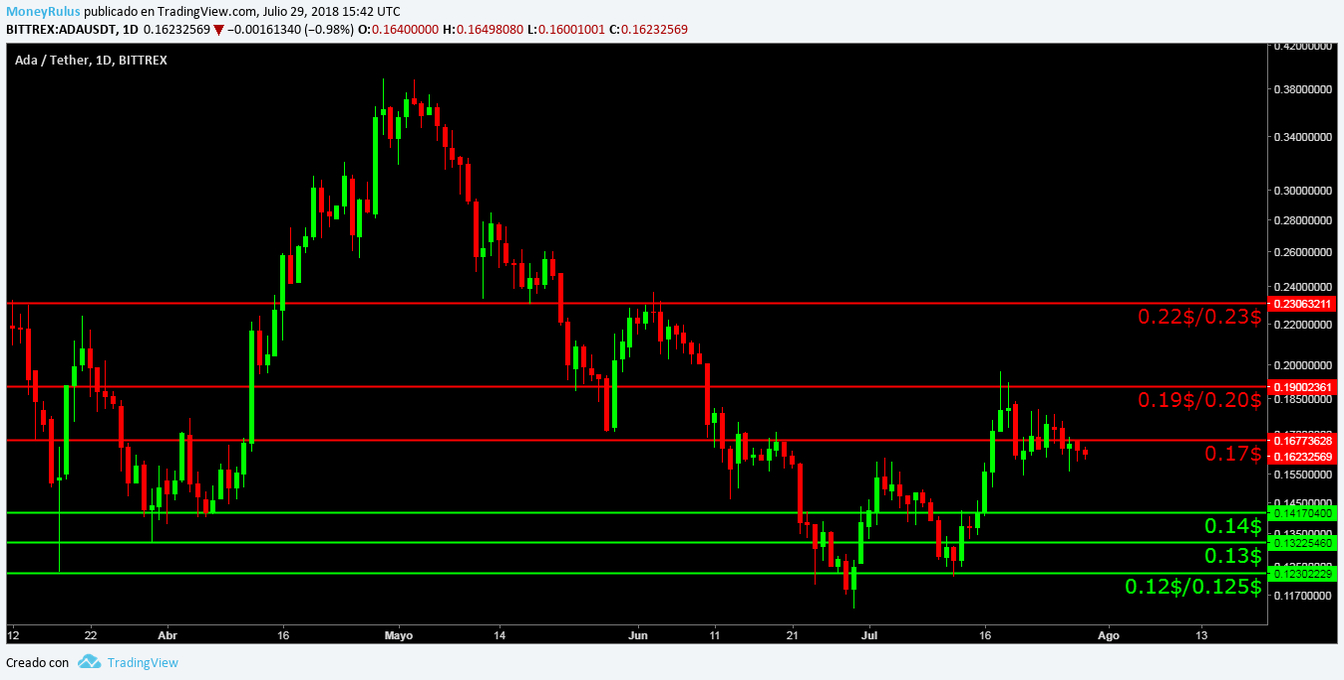 Bears can create pressure on sale and form resistance at 0.17 $, 0.19 $ / 0.20 $ and 0.22 $ / 0.23 $.
The bulls, on the other hand, can take defensive actions and establish supports in the areas of 0.14 $, 0.13 $ and 0.12 $ / 0.125 $.
Technical analysis – Stellar Lumens XLM / USD
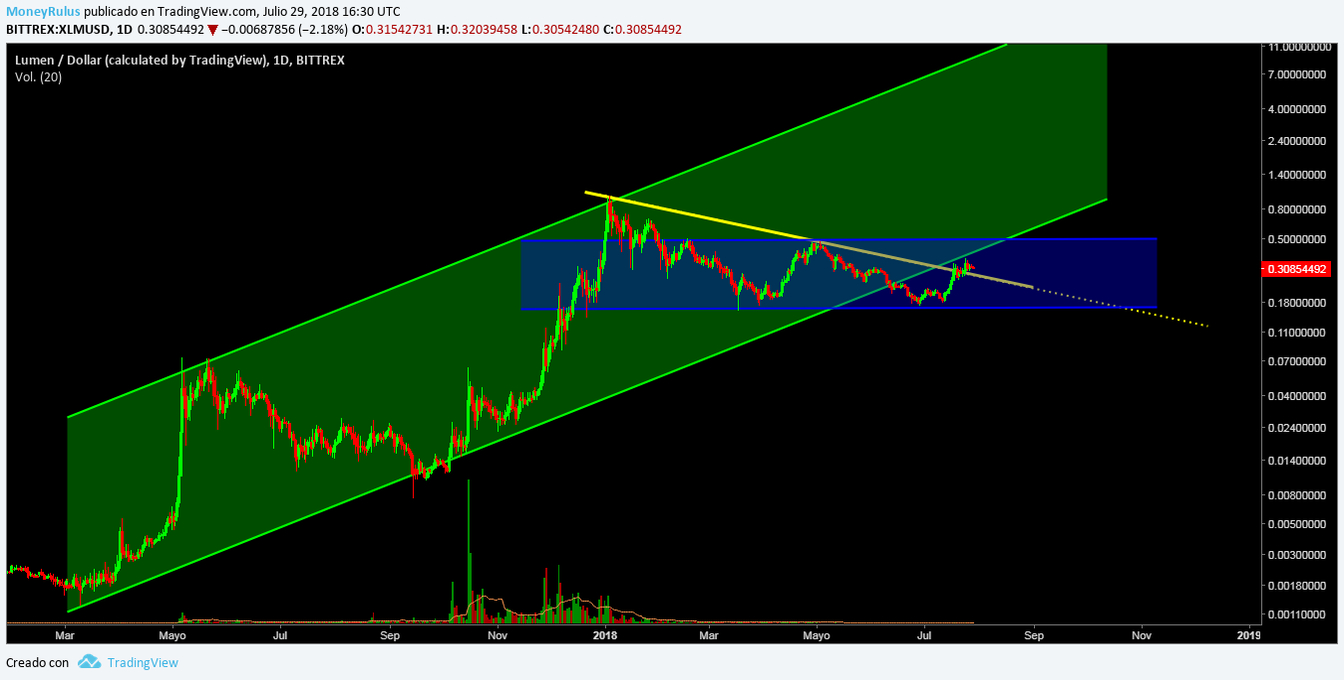
The XLM / USD pair in the Bittrex exchange house managed to break the line of descending tendency – yellow – medium term, which until recently was a strong resistance. In this moment there are no confirmations that verify the change, so it is a good idea to be smart and wait for them.
Even so, it seems that it acted as a support that helped the price to reach the bottom of the long-term rising – green – channel, this area at some point was an important support, but now it is planted as a possible ceiling, an area in which bears have the advantage to make the price fall and make new minimums, or at least an area that allows the attempt.
If it manages to break the lower trend line of the green channel, it could be directed towards the upper part of the lateral channel – blue – medium term, which has been a reference to take into account for a few months.
The fact that the coin remains lateral implies some stability that is interesting, so it remains a case with much to unravel.
The volume has given a pleasant surprise looking closely at their movements, since during the last 2 weeks it has increased quite a bit, during some exact moments, a signal that there is some interest in the currency. This does not last very long and becomes low again, so it is not a very reliable detail; Besides that, observing the general vision, the volume is invisible, a legend that seems to have been true some day. On numerous occasions we have commented on this, so we still find this lack of strength to be very unreliable.
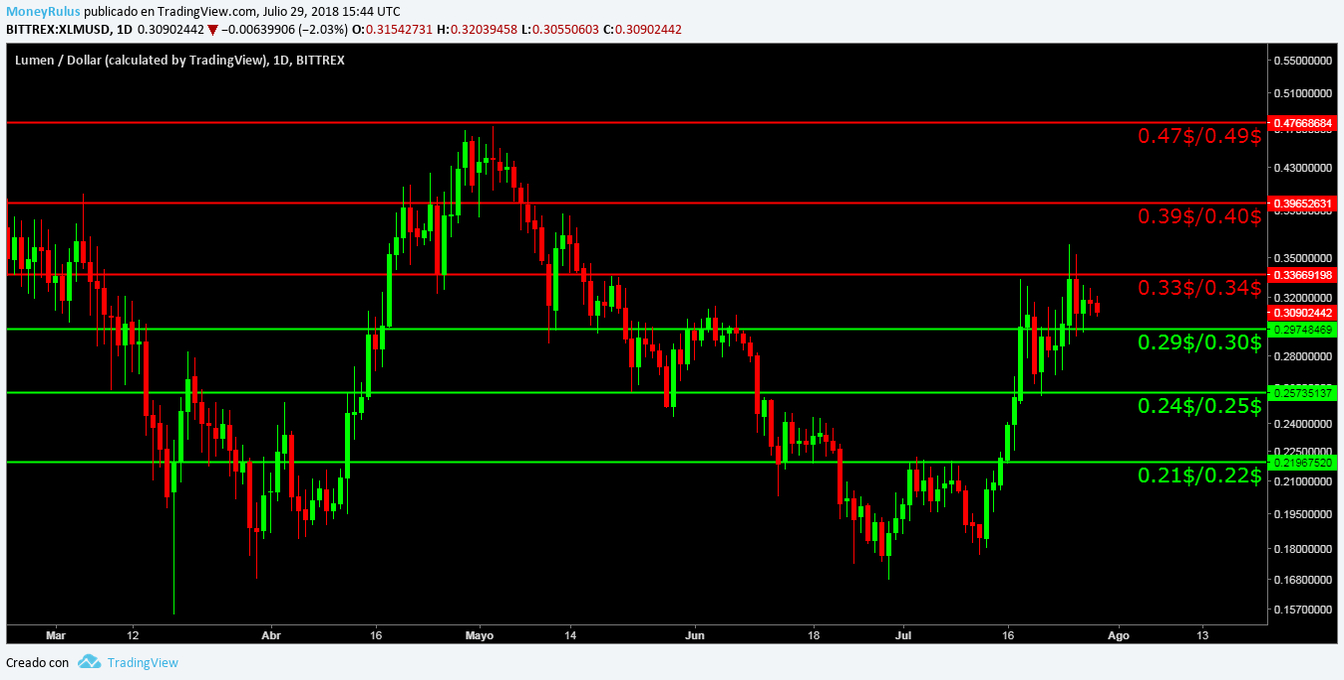
The bears can create possible ceilings at $ 0.33 / 0.34 $, $ 0.39 / $ 0.40 and $ 0.47 / $ 0.49.
And the bulls could establish supports in the areas of 0.29 $ / 0.30 $, 0.24 $ / 0.25 $ and 0.21 $ / 0.22 $.
Technical analysis – IOTA IOTA / USD
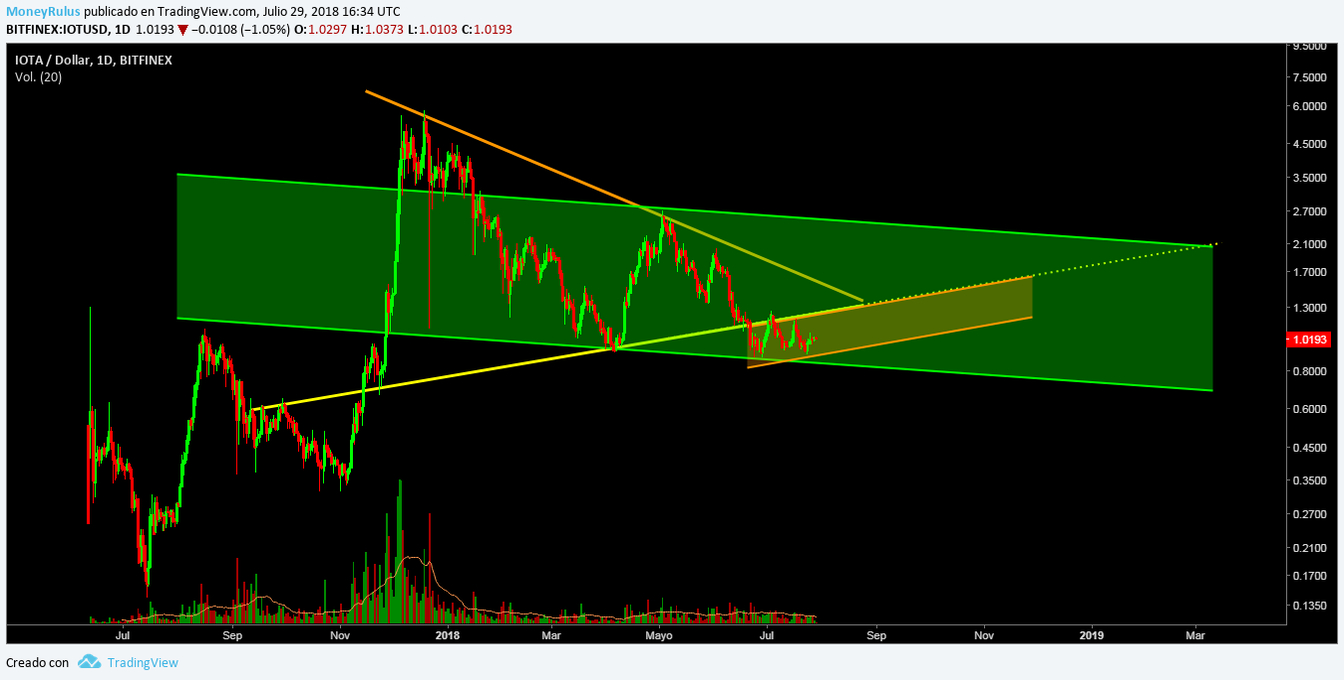 The penultimate pair is IOTA / USD in the BitFinex exchange house and shows that the price is in the lower part of the descending channel – green – medium term, this channel is important for this currency, since the price has fluctuated within it for a long time.
At this moment it just bounced on the support that is in the lower part of the channel, so it is possible that the price is directed towards the top of it, to try to break the resistance of this area and stay on a bullish course.
The medium-term rising – yellow – trend line is presented as an important resistance, so if the price tries to rise, it will have to face it again.
For some weeks now, the currency has been creating a short-term rising channel – orange – which shows a possible path that could continue to be traced, in order to continue on its upward course.
These short-term channels are fractals of medium-term channels, as these in turn are fractals of long-term channels. So that being so, all have the same meaning, only at a different scale. The medium-term downward trend line – orange – remains valid, only very distant, although it is still of value.
The volume during the last week has remained stable, a sign that although the force does not enter in large quantities, it at least remains at certain minimum level. As we said before, stability in volume is better than total absence.
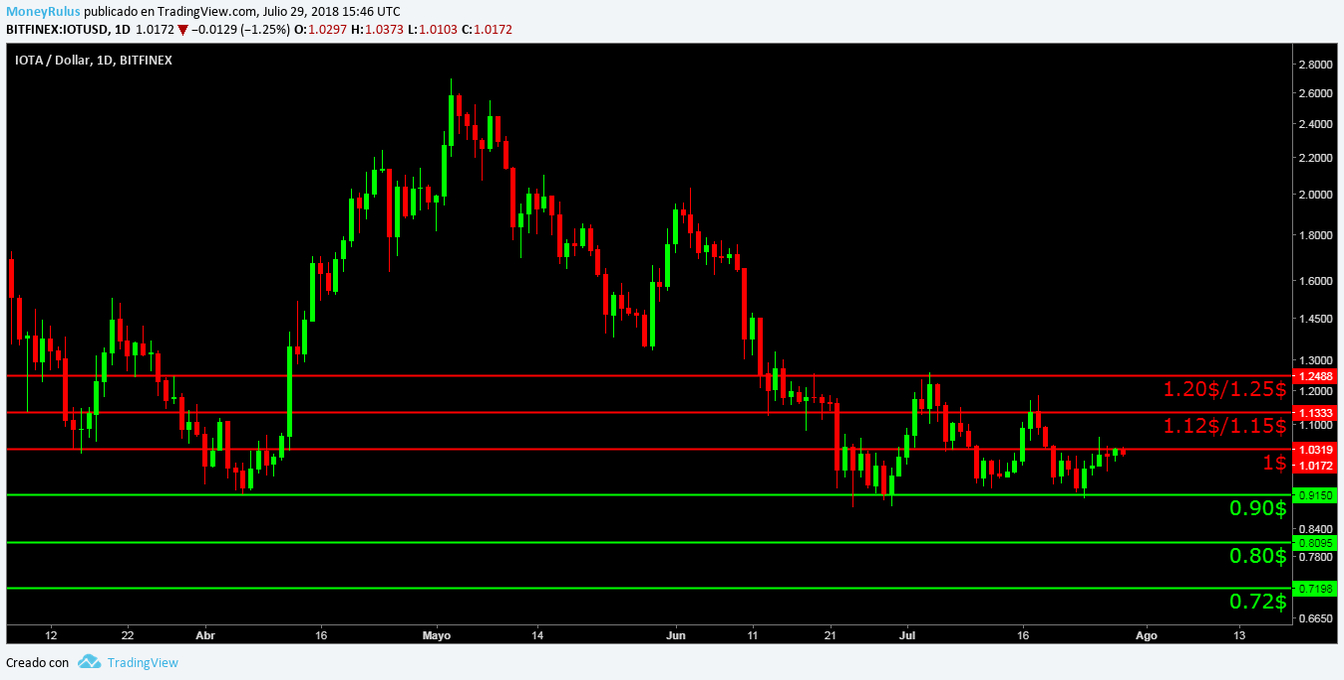
Bears can create resistances in the $ 1, $ 1.12 / $ 1.15 and $ 1.20 / $ 1.25 zones.
And consequently the bulls would do the same to form supports in $ 0.90, $ 0.80 and $ 0.72.
Technical analysis – Tron TRX / USD
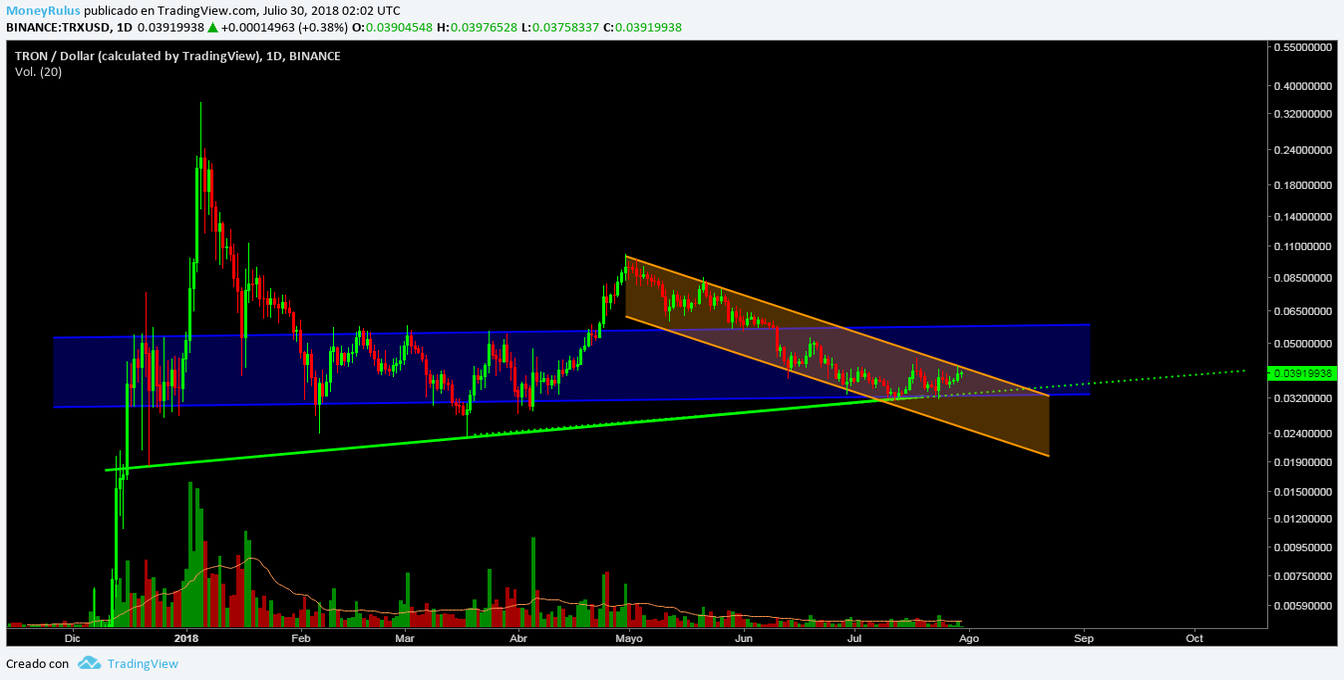
Finally, let us analyze the TRX / USD pair in the Binance exchange house, which again became the tenth most capitalized currency in the market. The graph shows that the price has been on a laterality for some weeks, in fact it is located near the bottom of the lateral channel – blue – long term, it has been in this strip for a few weeks, and during the last days bounced in this area, confirming that it is an area where the bulls have created a strong support, since every time the price approaches, the bulls increase the pressure to purchase and once again the support provides sustenance.
On top of that, at this time the price is also bouncing on the long-term upward-green trend line, which has served as a floor on numerous occasions in the past.
The concordance of the lower part of the blue channel and the support of the green trend line creates a strong area that can serve as a trench for the bulls, so that they increase the intention of purchases and achieve that the price makes a bounce in this area.
On the other hand, a medium-term descending – orange – channel has been creating itself for some months, which has been respected several times, both in its upper part that is a resistance, and in the lower part that acts as a support.
In case that the price remains within the orange channel, it is possible that it breaks the support that constitutes the blue channel and the green trend line, so the ideal is to wait to see which channel respects the price, if the orange channel indicates a bearish pattern or the blue channel that indicates a lateral or even slightly bullish pattern.
Between both of them it will have to invalidate one channel and respect another, and based on that the quotes will go one way or the other.
The volume has been stable for some time, so it is a sign of some tranquility in the market, although we already know that it is not ideal, it is more acceptable than a complete disappearance of the volume, which is a case that we understand thanks to XLM and its zero force.
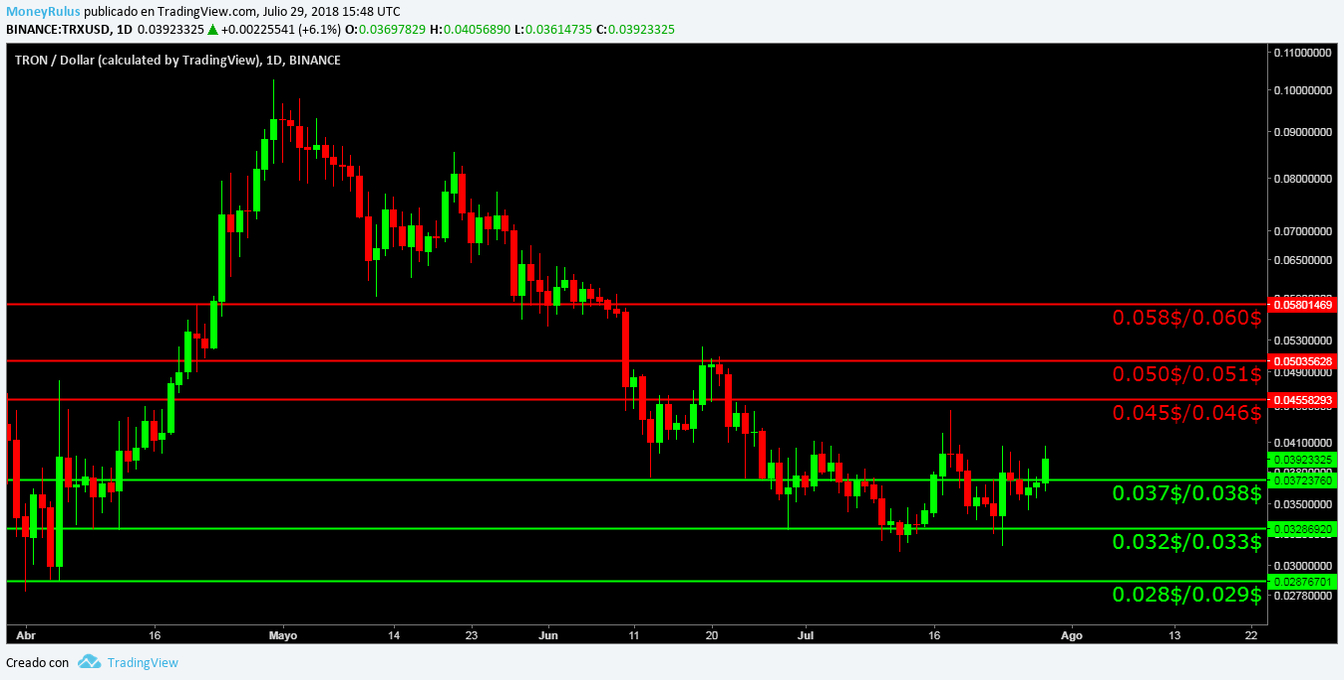
Bears can increase the pressure on sale and create resistance at $ 0.045 / 0.046 $, 0.050 $ / 0.051 $ and 0.058 $ / 0.060 $.
And finally, the bulls can erect more purchase intention and establish supports in the areas of 0.037 $ / 0.038 $, 0.032 $ / 0.033 $ and 0.028 $ / 0.029 $.
“This article has been made by our Analyst: Jose Antonio, Lover of learning and teaching, in love with trading and enthusiast of the Cryptophere. You can follow him on Steemit or TradingView“